 Web Server Statistics for aaa.casualmonitor.com
Program started on Sat, Jul 31 2021 at 7:03 PM.
Analyzed requests from Tue, Jun 01 2021 at 11:42 PM to Sat, Jul 31 2021 at 6:31 PM (59.78 days).
Web Server Statistics for aaa.casualmonitor.comProgram started on Sat, Jul 31 2021 at 7:03 PM.
Analyzed requests from Tue, Jun 01 2021 at 11:42 PM to Sat, Jul 31 2021 at 6:31 PM (59.78 days).
(Go To: Top | General Summary | Monthly Report | Daily Summary | Hourly Summary | Domain Report | Organization Report | Redirected Referrer Report | Referring Site Report | Browser Report | Browser Summary | Operating System Report | Status Code Report | File Size Report | File Type Report | Directory Report | Request Report)
Figures in parentheses refer to the 7-day period ending Jul 31 2021 at 7:03 PM.
Successful requests: 897 (109)
Average successful requests per day: 14 (15)
Failed requests: 326 (6)
Redirected requests: 2,524 (47)
Distinct files requested: 5 (185)
Distinct hosts served: 248 (906)
Data transferred: 6.56 megabytes (825.41 kilobytes)
Average data transferred per day: 112.37 kilobytes (117.92 kilobytes)
(Go To: Top | General Summary | Monthly Report | Daily Summary | Hourly Summary | Domain Report | Organization Report | Redirected Referrer Report | Referring Site Report | Browser Report | Browser Summary | Operating System Report | Status Code Report | File Size Report | File Type Report | Directory Report | Request Report)
Each unit ( ) represents 1 request for a page.
| month | #reqs | #pages | |
|---|---|---|---|
| Jun 2021 | 214 | 0 | |
| Jul 2021 | 683 | 0 |
Busiest month: Jun 2021 (0 requests for pages).
(Go To: Top | General Summary | Monthly Report | Daily Summary | Hourly Summary | Domain Report | Organization Report | Redirected Referrer Report | Referring Site Report | Browser Report | Browser Summary | Operating System Report | Status Code Report | File Size Report | File Type Report | Directory Report | Request Report)
Each unit () represents 1 request for a page.
| day | #reqs | #pages | |
|---|---|---|---|
| Sun | 123 | 0 | |
| Mon | 137 | 0 | |
| Tue | 137 | 0 | |
| Wed | 136 | 0 | |
| Thu | 153 | 0 | |
| Fri | 95 | 0 | |
| Sat | 116 | 0 |
(Go To: Top | General Summary | Monthly Report | Daily Summary | Hourly Summary | Domain Report | Organization Report | Redirected Referrer Report | Referring Site Report | Browser Report | Browser Summary | Operating System Report | Status Code Report | File Size Report | File Type Report | Directory Report | Request Report)
Each unit () represents 1 request for a page.
| hour | #reqs | #pages | |
|---|---|---|---|
| 0 | 33 | 0 | |
| 1 | 55 | 0 | |
| 2 | 44 | 0 | |
| 3 | 27 | 0 | |
| 4 | 40 | 0 | |
| 5 | 34 | 0 | |
| 6 | 40 | 0 | |
| 7 | 54 | 0 | |
| 8 | 49 | 0 | |
| 9 | 30 | 0 | |
| 10 | 33 | 0 | |
| 11 | 38 | 0 | |
| 12 | 27 | 0 | |
| 13 | 46 | 0 | |
| 14 | 49 | 0 | |
| 15 | 18 | 0 | |
| 16 | 53 | 0 | |
| 17 | 33 | 0 | |
| 18 | 25 | 0 | |
| 19 | 21 | 0 | |
| 20 | 33 | 0 | |
| 21 | 31 | 0 | |
| 22 | 33 | 0 | |
| 23 | 51 | 0 |
(Go To: Top | General Summary | Monthly Report | Daily Summary | Hourly Summary | Domain Report | Organization Report | Redirected Referrer Report | Referring Site Report | Browser Report | Browser Summary | Operating System Report | Status Code Report | File Size Report | File Type Report | Directory Report | Request Report)
Listing domains, sorted by the amount of traffic.
| #reqs | %bytes | domain |
|---|---|---|
| 897 | 100% | [unresolved numerical addresses] |
(Go To: Top | General Summary | Monthly Report | Daily Summary | Hourly Summary | Domain Report | Organization Report | Redirected Referrer Report | Referring Site Report | Browser Report | Browser Summary | Operating System Report | Status Code Report | File Size Report | File Type Report | Directory Report | Request Report)

Listing the top 20 organizations by the number of requests, sorted by the number of requests.
| #reqs | %bytes | organization |
|---|---|---|
| 233 | 25.82% | 45 |
| 69 | 7.77% | 128.14 |
| 53 | 5.99% | 66.249 |
| 49 | 5.51% | 193.107 |
| 36 | 4.06% | 183.136 |
| 30 | 3.39% | 92 |
| 29 | 3.27% | 193.118 |
| 21 | 2.37% | 23 |
| 20 | 2.25% | 128.1 |
| 18 | 2.03% | 113 |
| 17 | 1.91% | 172.105 |
| 16 | 1.80% | 74 |
| 15 | 1.69% | 82 |
| 12 | 1.35% | 77 |
| 12 | 1.35% | 104 |
| 12 | 1.35% | 205.185 |
| 11 | 1.24% | 162.142 |
| 10 | 1.13% | 162.221 |
| 9 | 1.02% | 125 |
| 9 | 1.01% | 185.180 |
| 216 | 23.67% | [not listed: 72 organizations] |
(Go To: Top | General Summary | Monthly Report | Daily Summary | Hourly Summary | Domain Report | Organization Report | Redirected Referrer Report | Referring Site Report | Browser Report | Browser Summary | Operating System Report | Status Code Report | File Size Report | File Type Report | Directory Report | Request Report)

Listing referring URLs, sorted by the number of redirected requests.
(Go To: Top | General Summary | Monthly Report | Daily Summary | Hourly Summary | Domain Report | Organization Report | Redirected Referrer Report | Referring Site Report | Browser Report | Browser Summary | Operating System Report | Status Code Report | File Size Report | File Type Report | Directory Report | Request Report)

Listing referring sites, sorted by the number of requests.
| #reqs | site |
|---|---|
| 507 | https://154.16.118.185/ |
| 15 | https://us1.solusitotal.com/ |
| 12 | https://us2.solusitotal.com/ |
| 7 | https://us1.vinhostmedia.com/ |
| 7 | https://us2.vinhostmedia.com/ |
| 4 | https://www.cmts-chape-liquide-carrelage.fr/ |
| 4 | http://www.google.com.hk/ |
| 4 | https://id1.vinhostmedia.com/ |
| 1 | http://variasigadget.com/ |
| 1 | https://ftp.solusitotal.com/ |
| 1 | https://google.com/ |
| 1 | https://nuna.solusitotal.com/ |
(Go To: Top | General Summary | Monthly Report | Daily Summary | Hourly Summary | Domain Report | Organization Report | Redirected Referrer Report | Referring Site Report | Browser Report | Browser Summary | Operating System Report | Status Code Report | File Size Report | File Type Report | Directory Report | Request Report)
Listing browsers with at least 1 request for a page, sorted by the number of requests for pages.
| #reqs | #pages | browser |
|---|---|---|
| 894 | 0 | [not listed: 83 browsers] |
(Go To: Top | General Summary | Monthly Report | Daily Summary | Hourly Summary | Domain Report | Organization Report | Redirected Referrer Report | Referring Site Report | Browser Report | Browser Summary | Operating System Report | Status Code Report | File Size Report | File Type Report | Directory Report | Request Report)
Listing browsers with at least 1 request for a page, sorted by the number of requests for pages.
| # | #reqs | #pages | browser |
|---|---|---|---|
| 894 | 0 | [not listed: 18 browsers] |
(Go To: Top | General Summary | Monthly Report | Daily Summary | Hourly Summary | Domain Report | Organization Report | Redirected Referrer Report | Referring Site Report | Browser Report | Browser Summary | Operating System Report | Status Code Report | File Size Report | File Type Report | Directory Report | Request Report)
Listing operating systems, sorted by the number of requests for pages.
| # | #reqs | #pages | OS |
|---|---|---|---|
| 1 | 142 | 0 | Unix |
| 142 | 0 | Linux | |
| 2 | 5 | 0 | Known robots |
| 3 | 67 | 0 | Macintosh |
| 4 | 146 | 0 | OS unknown |
| 5 | 534 | 0 | Windows |
| 470 | 0 | Windows NT | |
| 3 | 0 | Windows 2000 | |
| 8 | 0 | Windows XP | |
| 53 | 0 | Unknown Windows |
(Go To: Top | General Summary | Monthly Report | Daily Summary | Hourly Summary | Domain Report | Organization Report | Redirected Referrer Report | Referring Site Report | Browser Report | Browser Summary | Operating System Report | Status Code Report | File Size Report | File Type Report | Directory Report | Request Report)
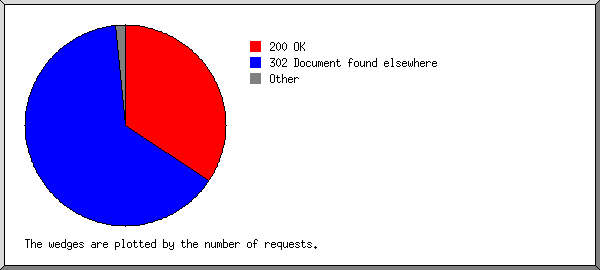
Listing status codes, sorted numerically.
| #reqs | status code |
|---|---|
| 897 | 200 OK |
| 2524 | 302 Document found elsewhere |
| 9 | 400 Bad request |
| 13 | 403 Access forbidden |
| 293 | 408 Request timeout |
| 11 | 4xx [Miscellaneous client/user errors] |
(Go To: Top | General Summary | Monthly Report | Daily Summary | Hourly Summary | Domain Report | Organization Report | Redirected Referrer Report | Referring Site Report | Browser Report | Browser Summary | Operating System Report | Status Code Report | File Size Report | File Type Report | Directory Report | Request Report)

| size | #reqs | %bytes |
|---|---|---|
| 0 | 10 | |
| 1B- 10B | 0 | |
| 11B- 100B | 0 | |
| 101B- 1kB | 0 | |
| 1kB- 10kB | 887 | 100% |
(Go To: Top | General Summary | Monthly Report | Daily Summary | Hourly Summary | Domain Report | Organization Report | Redirected Referrer Report | Referring Site Report | Browser Report | Browser Summary | Operating System Report | Status Code Report | File Size Report | File Type Report | Directory Report | Request Report)
Listing extensions with at least 0.1% of the traffic, sorted by the amount of traffic.
| #reqs | %bytes | extension |
|---|---|---|
| 897 | 100% | .cgi [CGI scripts] |
(Go To: Top | General Summary | Monthly Report | Daily Summary | Hourly Summary | Domain Report | Organization Report | Redirected Referrer Report | Referring Site Report | Browser Report | Browser Summary | Operating System Report | Status Code Report | File Size Report | File Type Report | Directory Report | Request Report)
Listing directories with at least 0.01% of the traffic, sorted by the amount of traffic.
| #reqs | %bytes | directory |
|---|---|---|
| 897 | 100% | /cgi-sys/ |
(Go To: Top | General Summary | Monthly Report | Daily Summary | Hourly Summary | Domain Report | Organization Report | Redirected Referrer Report | Referring Site Report | Browser Report | Browser Summary | Operating System Report | Status Code Report | File Size Report | File Type Report | Directory Report | Request Report)
Listing files with at least 20 requests, sorted by the number of requests.
| #reqs | %bytes | last time | file |
|---|---|---|---|
| 897 | 100% | Jul/31/21 1:11 PM | /cgi-sys/suspendedpage.cgi |
| 24 | 2.71% | Jul/31/21 2:52 AM | /cgi-sys/suspendedpage.cgi?s=/Index/\\think\\app/invokefunction&function=call_user_func_array&vars[0]=md5&vars[1][]=HelloThinkPHP21 |
| 18 | 1.92% | Jul/31/21 2:52 AM | /cgi-sys/suspendedpage.cgi?XDEBUG_SESSION_START=phpstorm |