 Web Server Statistics for adhibs.com
Program started on Fri, Mar 05 2021 at 5:00 PM.
Analyzed requests from Fri, Mar 05 2021 at 11:11 AM to Fri, Mar 05 2021 at 12:47 PM (0.07 days).
Web Server Statistics for adhibs.comProgram started on Fri, Mar 05 2021 at 5:00 PM.
Analyzed requests from Fri, Mar 05 2021 at 11:11 AM to Fri, Mar 05 2021 at 12:47 PM (0.07 days).
(Go To: Top | General Summary | Monthly Report | Daily Summary | Hourly Summary | Domain Report | Organization Report | Browser Report | Browser Summary | Operating System Report | Status Code Report | File Size Report | File Type Report | Directory Report | Request Report)
Successful requests: 44
Average successful requests per day: 645
Failed requests: 2
Distinct files requested: 4
Distinct hosts served: 4
Data transferred: 73.50 kilobytes
Average data transferred per day: 1.08 megabytes
(Go To: Top | General Summary | Monthly Report | Daily Summary | Hourly Summary | Domain Report | Organization Report | Browser Report | Browser Summary | Operating System Report | Status Code Report | File Size Report | File Type Report | Directory Report | Request Report)
Each unit ( ) represents 1 request for a page.
| month | #reqs | #pages | |
|---|---|---|---|
| Mar 2021 | 44 | 0 |
Busiest month: Mar 2021 (0 requests for pages).
(Go To: Top | General Summary | Monthly Report | Daily Summary | Hourly Summary | Domain Report | Organization Report | Browser Report | Browser Summary | Operating System Report | Status Code Report | File Size Report | File Type Report | Directory Report | Request Report)
Each unit () represents 1 request for a page.
| day | #reqs | #pages | |
|---|---|---|---|
| Sun | 0 | 0 | |
| Mon | 0 | 0 | |
| Tue | 0 | 0 | |
| Wed | 0 | 0 | |
| Thu | 0 | 0 | |
| Fri | 44 | 0 | |
| Sat | 0 | 0 |
(Go To: Top | General Summary | Monthly Report | Daily Summary | Hourly Summary | Domain Report | Organization Report | Browser Report | Browser Summary | Operating System Report | Status Code Report | File Size Report | File Type Report | Directory Report | Request Report)
Each unit () represents 1 request for a page.
| hour | #reqs | #pages | |
|---|---|---|---|
| 0 | 0 | 0 | |
| 1 | 0 | 0 | |
| 2 | 0 | 0 | |
| 3 | 0 | 0 | |
| 4 | 0 | 0 | |
| 5 | 0 | 0 | |
| 6 | 0 | 0 | |
| 7 | 0 | 0 | |
| 8 | 0 | 0 | |
| 9 | 0 | 0 | |
| 10 | 0 | 0 | |
| 11 | 44 | 0 | |
| 12 | 0 | 0 | |
| 13 | 0 | 0 | |
| 14 | 0 | 0 | |
| 15 | 0 | 0 | |
| 16 | 0 | 0 | |
| 17 | 0 | 0 | |
| 18 | 0 | 0 | |
| 19 | 0 | 0 | |
| 20 | 0 | 0 | |
| 21 | 0 | 0 | |
| 22 | 0 | 0 | |
| 23 | 0 | 0 |
(Go To: Top | General Summary | Monthly Report | Daily Summary | Hourly Summary | Domain Report | Organization Report | Browser Report | Browser Summary | Operating System Report | Status Code Report | File Size Report | File Type Report | Directory Report | Request Report)
Listing domains, sorted by the amount of traffic.
| #reqs | %bytes | domain |
|---|---|---|
| 44 | 100% | [unresolved numerical addresses] |
(Go To: Top | General Summary | Monthly Report | Daily Summary | Hourly Summary | Domain Report | Organization Report | Browser Report | Browser Summary | Operating System Report | Status Code Report | File Size Report | File Type Report | Directory Report | Request Report)
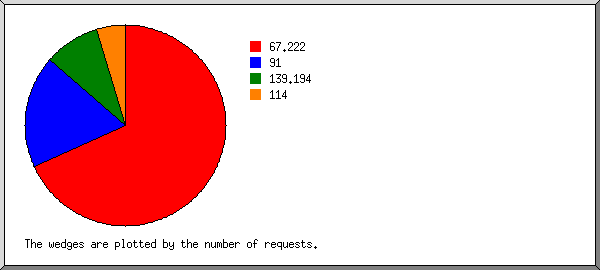
Listing organizations, sorted by the number of requests.
| #reqs | %bytes | organization |
|---|---|---|
| 30 | 3.03% | 67.222 |
| 8 | 0.89% | 91 |
| 4 | 64.05% | 139.194 |
| 2 | 32.02% | 114 |
(Go To: Top | General Summary | Monthly Report | Daily Summary | Hourly Summary | Domain Report | Organization Report | Browser Report | Browser Summary | Operating System Report | Status Code Report | File Size Report | File Type Report | Directory Report