 Web Server Statistics for anggawifi.com
Program started on Sat, Jul 31 2021 at 7:19 PM.
Analyzed requests from Sat, May 08 2021 at 9:00 PM to Sat, Jul 31 2021 at 6:57 PM (83.91 days).
Web Server Statistics for anggawifi.comProgram started on Sat, Jul 31 2021 at 7:19 PM.
Analyzed requests from Sat, May 08 2021 at 9:00 PM to Sat, Jul 31 2021 at 6:57 PM (83.91 days).
(Go To: Top | General Summary | Monthly Report | Daily Summary | Hourly Summary | Domain Report | Organization Report | Failed Referrer Report | Browser Report | Browser Summary | Operating System Report | Status Code Report | File Size Report | File Type Report | Directory Report | Request Report)
Figures in parentheses refer to the 7-day period ending Jul 31 2021 at 7:19 PM.
Successful requests: 2,160 (0)
Average successful requests per day: 25
Successful requests for pages: 16 (0)
Failed requests: 154,202 (92)
Requests with informational status code: 179 (0)
Distinct files requested: 32 (239)
Distinct hosts served: 18 (1,133)
Data transferred: 10.74 megabytes (0 bytes)
Average data transferred per day: 131.09 kilobytes (0 bytes)
(Go To: Top | General Summary | Monthly Report | Daily Summary | Hourly Summary | Domain Report | Organization Report | Failed Referrer Report | Browser Report | Browser Summary | Operating System Report | Status Code Report | File Size Report | File Type Report | Directory Report | Request Report)
Each unit ( ) represents 1 request for a page.
| month | #reqs | #pages | |
|---|---|---|---|
| May 2021 | 2129 | 0 | |
| Jun 2021 | 18 | 16 |  |
| Jul 2021 | 13 | 0 |
Busiest month: Jun 2021 (16 requests for pages).
(Go To: Top | General Summary | Monthly Report | Daily Summary | Hourly Summary | Domain Report | Organization Report | Failed Referrer Report | Browser Report | Browser Summary | Operating System Report | Status Code Report | File Size Report | File Type Report | Directory Report | Request Report)
Each unit () represents 1 request for a page.
| day | #reqs | #pages | |
|---|---|---|---|
| Sun | 0 | 0 | |
| Mon | 87 | 0 | |
| Tue | 28 | 1 | |
| Wed | 0 | 0 | |
| Thu | 0 | 0 | |
| Fri | 23 | 11 |   |
| Sat | 2022 | 4 |  |
(Go To: Top | General Summary | Monthly Report | Daily Summary | Hourly Summary | Domain Report | Organization Report | Failed Referrer Report | Browser Report | Browser Summary | Operating System Report | Status Code Report | File Size Report | File Type Report | Directory Report | Request Report)
Each unit () represents 1 request for a page.
| hour | #reqs | #pages | |
|---|---|---|---|
| 0 | 0 | 0 | |
| 1 | 0 | 0 | |
| 2 | 0 | 0 | |
| 3 | 0 | 0 | |
| 4 | 0 | 0 | |
| 5 | 1 | 1 | |
| 6 | 0 | 0 | |
| 7 | 12 | 0 | |
| 8 | 0 | 0 | |
| 9 | 0 | 0 | |
| 10 | 0 | 0 | |
| 11 | 27 | 0 | |
| 12 | 11 | 11 | |
| 13 | 1 | 1 | |
| 14 | 3 | 1 | |
| 15 | 0 | 0 | |
| 16 | 87 | 0 | |
| 17 | 0 | 0 | |
| 18 | 0 | 0 | |
| 19 | 0 | 0 | |
| 20 | 1 | 0 | |
| 21 | 2016 | 1 | |
| 22 | 1 | 1 | |
| 23 | 0 | 0 |
(Go To: Top | General Summary | Monthly Report | Daily Summary | Hourly Summary | Domain Report | Organization Report | Failed Referrer Report | Browser Report | Browser Summary | Operating System Report | Status Code Report | File Size Report | File Type Report | Directory Report | Request Report)
Listing domains, sorted by the amount of traffic.
| #reqs | %bytes | domain |
|---|---|---|
| 2160 | 100% | [unresolved numerical addresses] |
(Go To: Top | General Summary | Monthly Report | Daily Summary | Hourly Summary | Domain Report | Organization Report | Failed Referrer Report | Browser Report | Browser Summary | Operating System Report | Status Code Report | File Size Report | File Type Report | Directory Report | Request Report)

Listing organizations, sorted by the number of requests.
| #reqs | %bytes | organization |
|---|---|---|
| 1440 | 0.97% | 67.222 |
| 384 | 0.29% | 91 |
| 183 | 55.04% | 118 |
| 122 | 36.71% | 103 |
| 10 | 3.35% | 184.170 |
| 8 | 154.16 | |
| 4 | 1.01% | 34 |
| 3 | 1.66% | 61.135 |
| 2 | 18 | |
| 1 | 0.30% | 182.253 |
| 1 | 0.34% | 82 |
| 1 | 0.34% | 92 |
| 1 | 64.78 |
(Go To: Top | General Summary | Monthly Report | Daily Summary | Hourly Summary | Domain Report | Organization Report | Failed Referrer Report | Browser Report | Browser Summary | Operating System Report | Status Code Report | File Size Report | File Type Report | Directory Report | Request Report)
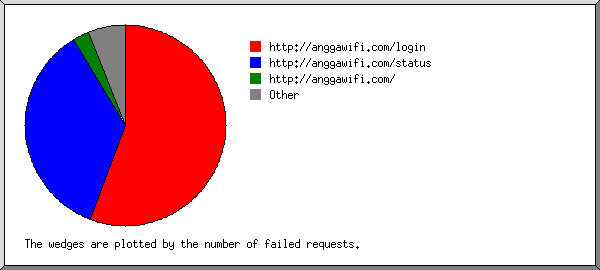
Listing referring URLs, sorted by the number of failed requests.
(Go To: Top | General Summary | Monthly Report | Daily Summary | Hourly Summary | Domain Report | Organization Report | Failed Referrer Report | Browser Report | Browser Summary | Operating System Report | Status Code Report | File Size Report | File Type Report | Directory Report | Request Report)

Listing browsers with at least 1 request for a page, sorted by the number of requests for pages.
| #reqs | #pages | browser |
|---|---|---|
| 10 | 10 | Mozilla/5.0 (X11; Ubuntu; Linux x86_64; rv:62.0) Gecko/20100101 Firefox/62.0 |
| 3 | 3 | Expanse, a Palo Alto Networks company, searches across the global IPv4 space multiple times per day to identify customers' presences on the Internet. If you would like to be excluded from our scans, please send IP addresses/domains to: [email protected] |
| 1 | 1 | NetSystemsResearch studies the availability of various services across the internet. Our website is netsystemsresearch.com |
| 1 | 1 | Mozilla/5.0 (Linux; Android 10; LIO-AN00 Build/HUAWEILIO-AN00; wv) AppleWebKit/537.36 (KHTML, like Gecko) Version/4.0 Chrome/78.0.3904.62 XWEB/2692 MMWEBSDK/200901 Mobile Safari/537.36 |
| 3 | 1 | Mozilla/5.0 (Linux; U; Android 9; zh-cn; RMX1901 Build/QKQ1.190918.001) AppleWebKit/537.36 (KHTML, like Gecko) Version/4.0 Chrome/70.0.3538.80 Mobile Safari/537.36 HeyTapBrowser/40.7.22.1 |
| 2142 | 0 | [not listed: 8 browsers] |
(Go To: Top | General Summary | Monthly Report | Daily Summary | Hourly Summary | Domain Report | Organization Report | Failed Referrer Report | Browser Report | Browser Summary | Operating System Report | Status Code Report | File Size Report | File Type Report | Directory Report | Request Report)

Listing browsers with at least 1 request for a page, sorted by the number of requests for pages.
| # | #reqs | #pages | browser |
|---|---|---|---|
| 1 | 10 | 10 | Firefox |
| 10 | 10 | Firefox/62 | |
| 2 | 3 | 3 | Expanse, a Palo Alto Networks company, searches across the global IPv4 space multiple times per day to identify customers' presences on the Internet. If you would like to be excluded from our scans, please send IP addresses |
| 3 | 3 | Expanse, a Palo Alto Networks company, searches across the global IPv4 space multiple times per day to identify customers' presences on the Internet. If you would like to be excluded from our scans, please send IP addresses/domains | |
| 3 | 310 | 2 | Safari |
| 310 | 2 | Safari/537 | |
| 4 | 1 | 1 | NetSystemsResearch studies the availability of various services across the internet. Our website is netsystemsresearch.com |
| 1836 | 0 | [not listed: 4 browsers] |
(Go To: Top | General Summary | Monthly Report | Daily Summary | Hourly Summary | Domain Report | Organization Report | Failed Referrer Report | Browser Report | Browser Summary | Operating System Report | Status Code Report | File Size Report | File Type Report | Directory Report | Request Report)

Listing operating systems, sorted by the number of requests for pages.
| # | #reqs | #pages | OS |
|---|---|---|---|
| 1 | 293 | 12 | Unix |
| 293 | 12 | Linux | |
| 2 | 1840 | 4 | OS unknown |
| 3 | 27 | 0 | Windows |
| 27 | 0 | Windows NT |
(Go To: Top | General Summary | Monthly Report | Daily Summary | Hourly Summary | Domain Report | Organization Report | Failed Referrer Report | Browser Report | Browser Summary | Operating System Report | Status Code Report | File Size Report | File Type Report | Directory Report | Request Report)
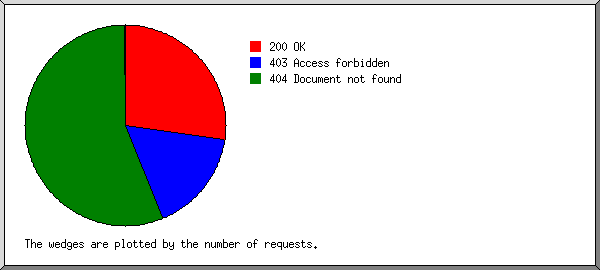
Listing status codes, sorted numerically.
| #reqs | status code |
|---|---|
| 179 | 101 Switching protocols |
| 2160 | 200 OK |
| 30 | 401 Authentication required |
| 42408 | 403 Access forbidden |
| 111764 | 404 Document not found |
(Go To: Top | General Summary | Monthly Report | Daily Summary | Hourly Summary | Domain Report | Organization Report | Failed Referrer Report | Browser Report | Browser Summary | Operating System Report | Status Code Report | File Size Report | File Type Report | Directory Report | Request Report)
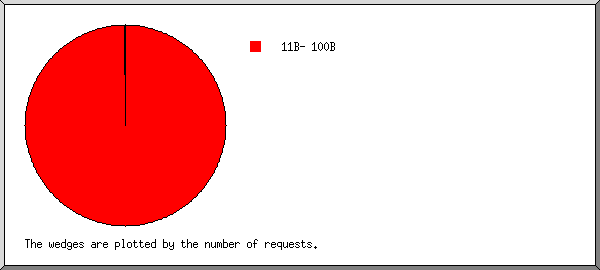
| size | #reqs | %bytes |
|---|---|---|
| 0 | 0 | |
| 1B- 10B | 0 | |
| 11B- 100B | 1836 | 1.27% |
| 101B- 1kB | 0 | |
| 1kB- 10kB | 1 | 0.06% |
| 10kB-100kB | 322 | 97.41% |
| 100kB- 1MB | 1 | 1.26% |
(Go To: Top | General Summary | Monthly Report | Daily Summary | Hourly Summary | Domain Report | Organization Report | Failed Referrer Report | Browser Report | Browser Summary | Operating System Report | Status Code Report | File Size Report | File Type Report | Directory Report | Request Report)

Listing extensions with at least 0.1% of the traffic, sorted by the amount of traffic.
| #reqs | %bytes | extension |
|---|---|---|
| 318 | 92.05% | [no extension] |
| 16 | 5.37% | [directories] |
| 2 | 1.32% | .css [Cascading Style Sheets] |
| 1824 | 1.26% | .txt [Plain text] |
(Go To: Top | General Summary | Monthly Report | Daily Summary | Hourly Summary | Domain Report | Organization Report | Failed Referrer Report | Browser Report | Browser Summary | Operating System Report | Status Code Report | File Size Report | File Type Report | Directory Report | Request Report)
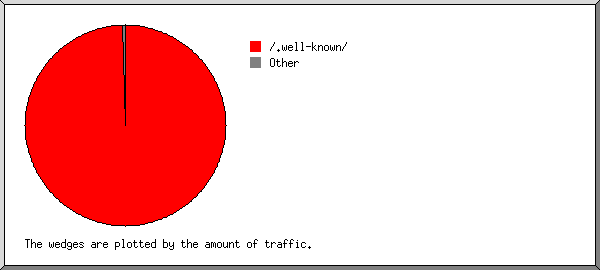
Listing directories with at least 0.01% of the traffic, sorted by the amount of traffic.
| #reqs | %bytes | directory |
|---|---|---|
| 312 | 94.06% | [root directory] |
| 1836 | 1.27% | /.well-known/ |
| 1 | 1.26% | /cPanel_magic_revision_1621001331/ |
| 2 | 0.67% | /test/ |
| 1 | 0.34% | /staging/ |
| 1 | 0.34% | /magento/ |
| 1 | 0.34% | /store/ |
| 1 | 0.34% | /demo/ |
| 1 | 0.34% | /shop/ |
| 1 | 0.34% | /dev/ |
| 1 | 0.34% | /old/ |
| 1 | 0.34% | /index.php/ |
| 1 | 0.06% | /cPanel_magic_revision_1386192030/ |
(Go To: Top | General Summary | Monthly Report | Daily Summary | Hourly Summary | Domain Report | Organization Report | Failed Referrer Report | Browser Report | Browser Summary | Operating System Report | Status Code Report | File Size Report | File Type Report | Directory Report | Request Report)

Listing files with at least 20 requests, sorted by the number of requests.
| #reqs | %bytes | last time | file |
|---|---|---|---|
| 1728 | 1.21% | May/ 8/21 9:04 PM | /.well-known/pki-validation/5C3E6A0844859AE290A53BFFDEB34718.txt |
| 219 | 65.90% | Jul/ 3/21 8:34 PM | /cpanel |
| 96 | 0.05% | May/ 8/21 9:04 PM | /.well-known/pki-validation/D711D8C383BC15C90684993CCD6AABF6.txt |
| 50 | 0.03% | May/ 8/21 9:04 PM | /.well-known/pki-validation/D711D8C383BC15C90684993CCD6AABF6.txt?114.125.210.67 |
| 38 | 0.02% | May/ 8/21 9:04 PM | /.well-known/pki-validation/D711D8C383BC15C90684993CCD6AABF6.txt?34.77.162.18 |
| 87 | 26.15% | May/10/21 4:19 PM | /whm |
| 30 | 6.69% | Jul/ 9/21 7:45 AM | [not listed: 21 files] |