 Web Server Statistics for jp.cumaiseng.co
Program started on Tue, Apr 28 2020 at 8:47 PM.
Analyzed requests from Mon, Feb 17 2020 at 3:54 AM to Tue, Apr 28 2020 at 5:13 PM (71.55 days).
Web Server Statistics for jp.cumaiseng.coProgram started on Tue, Apr 28 2020 at 8:47 PM.
Analyzed requests from Mon, Feb 17 2020 at 3:54 AM to Tue, Apr 28 2020 at 5:13 PM (71.55 days).
(Go To: Top | General Summary | Monthly Report | Daily Summary | Hourly Summary | Domain Report | Organization Report | Failed Referrer Report | Browser Report | Browser Summary | Operating System Report | Status Code Report | File Size Report | File Type Report | Directory Report | Request Report)
Figures in parentheses refer to the 7-day period ending Apr 28 2020 at 8:47 PM.
Successful requests: 3,062 (0)
Average successful requests per day: 42
Successful requests for pages: 2,592 (0)
Average successful requests for pages per day: 36
Failed requests: 13,878 (4)
Redirected requests: 724 (0)
Distinct files requested: 33 (81)
Distinct hosts served: 42 (79)
Data transferred: 58.06 megabytes (0 bytes)
Average data transferred per day: 830.89 kilobytes (0 bytes)
(Go To: Top | General Summary | Monthly Report | Daily Summary | Hourly Summary | Domain Report | Organization Report | Failed Referrer Report | Browser Report | Browser Summary | Operating System Report | Status Code Report | File Size Report | File Type Report | Directory Report | Request Report)
Each unit ( ) represents 40 requests for pages or part thereof.
| month | #reqs | #pages | |
|---|---|---|---|
| Feb 2020 | 1383 | 1236 |     |
| Mar 2020 | 1526 | 1203 | |
| Apr 2020 | 153 | 153 | |
Busiest month: Feb 2020 (1,236 requests for pages).
(Go To: Top | General Summary | Monthly Report | Daily Summary | Hourly Summary | Domain Report | Organization Report | Failed Referrer Report | Browser Report | Browser Summary | Operating System Report | Status Code Report | File Size Report | File Type Report | Directory Report | Request Report)
Each unit () represents 25 requests for pages or part thereof.
| day | #reqs | #pages | |
|---|---|---|---|
| Sun | 916 | 605 | |
| Mon | 1050 | 1050 |  |
| Tue | 407 | 308 | |
| Wed | 130 | 130 | |
| Thu | 399 | 387 | |
| Fri | 83 | 83 | |
| Sat | 77 | 29 | |
(Go To: Top | General Summary | Monthly Report | Daily Summary | Hourly Summary | Domain Report | Organization Report | Failed Referrer Report | Browser Report | Browser Summary | Operating System Report | Status Code Report | File Size Report | File Type Report | Directory Report | Request Report)
Each unit () represents 15 requests for pages or part thereof.
| hour | #reqs | #pages | |
|---|---|---|---|
| 0 | 430 | 376 | |
| 1 | 14 | 14 | |
| 2 | 2 | 2 | |
| 3 | 801 | 542 | |
| 4 | 285 | 285 | |
| 5 | 65 | 65 | |
| 6 | 0 | 0 | |
| 7 | 52 | 0 | |
| 8 | 0 | 0 | |
| 9 | 0 | 0 | |
| 10 | 21 | 21 | |
| 11 | 0 | 0 | |
| 12 | 0 | 0 | |
| 13 | 168 | 168 | |
| 14 | 37 | 37 | |
| 15 | 15 | 15 | |
| 16 | 30 | 30 | |
| 17 | 175 | 130 | |
| 18 | 453 | 405 | |
| 19 | 248 | 248 | |
| 20 | 73 | 73 | |
| 21 | 11 | 11 | |
| 22 | 20 | 8 | |
| 23 | 162 | 162 | |
(Go To: Top | General Summary | Monthly Report | Daily Summary | Hourly Summary | Domain Report | Organization Report | Failed Referrer Report | Browser Report | Browser Summary | Operating System Report | Status Code Report | File Size Report | File Type Report | Directory Report | Request Report)
Listing domains, sorted by the amount of traffic.
| #reqs | %bytes | domain |
|---|---|---|
| 3062 | 100% | [unresolved numerical addresses] |
(Go To: Top | General Summary | Monthly Report | Daily Summary | Hourly Summary | Domain Report | Organization Report | Failed Referrer Report | Browser Report | Browser Summary | Operating System Report | Status Code Report | File Size Report | File Type Report | Directory Report | Request Report)

Listing the top 20 organizations by the number of requests, sorted by the number of requests.
| #reqs | %bytes | organization |
|---|---|---|
| 615 | 37.69% | 77 |
| 387 | 23.72% | 193.37 |
| 372 | 3.80% | 110 |
| 239 | 6.39% | 195.154 |
| 235 | 0.32% | 182.0 |
| 223 | 9.16% | 209.17 |
| 221 | 7.04% | 62.210 |
| 130 | 1.42% | 51 |
| 114 | 0.12% | 181.215 |
| 114 | 1.15% | 38 |
| 106 | 2.10% | 185.234 |
| 57 | 185.220 | |
| 57 | 1.10% | 181.214 |
| 54 | 1.04% | 5 |
| 48 | 2.67% | 180.251 |
| 40 | 0.77% | 91 |
| 19 | 0.36% | 163.172 |
| 12 | 0.37% | 192.95 |
| 10 | 0.61% | 104 |
| 9 | 0.17% | 170.130 |
(Go To: Top | General Summary | Monthly Report | Daily Summary | Hourly Summary | Domain Report | Organization Report | Failed Referrer Report | Browser Report | Browser Summary | Operating System Report | Status Code Report | File Size Report | File Type Report | Directory Report | Request Report)
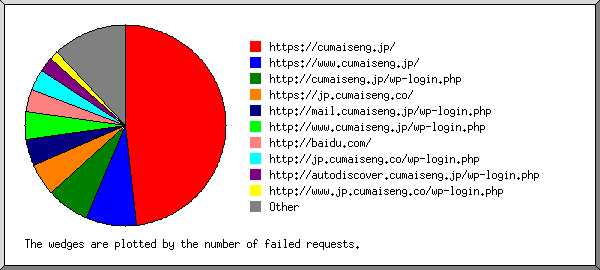
Listing referring URLs, sorted by the number of failed requests.
| #reqs | URL |
|---|---|
| 47 | https://cumaiseng.jp/ |
| 2 | http://autodiscover.cumaiseng.jp/wp-login.php |
(Go To: Top | General Summary | Monthly Report | Daily Summary | Hourly Summary | Domain Report | Organization Report | Failed Referrer Report | Browser Report | Browser Summary | Operating System Report | Status Code Report | File Size Report | File Type Report | Directory Report | Request Report)

Listing browsers with at least 1 request for a page, sorted by the number of requests for pages.
| #reqs | #pages | browser |
|---|---|---|
| 1042 | 837 | Mozilla/5.0 (X11; Ubuntu; Linux x86_64; rv:62.0) Gecko/20100101 Firefox/62.0 |
| 460 | 460 | Mozilla/5.0 (X11; Ubuntu; Linux x86_64; rv:58.0) Gecko/20100101 Firefox/58.0 |
| 526 | 327 | Mozilla/5.0 (Windows NT 10.0; Win64; x64; rv:73.0) Gecko/20100101 Firefox/73.0 |
| 235 | 235 | Mozilla/5.0 (Linux; Android 9; vivo 1918) AppleWebKit/537.36 (KHTML, like Gecko) Chrome/80.0.3987.117 Mobile Safari/537.36 |
| 223 | 223 | Mozilla/5.0 (compatible; Nimbostratus-Bot/v1.3.2; http://cloudsystemnetworks.com) |
| 92 | 92 | Mozilla/5.0 (X11; Linux x86_64) AppleWebKit/537.36 (KHTML, like Gecko) Chrome/78.0.3904.108 Safari/537.36 |
| 57 | 57 | Mozilla/5.0 (iPad; CPU OS 10_3_3 like Mac OS X) AppleWebKit/603.3.8 (KHTML, like Gecko) Version/10.0 Mobile/14G60 Safari/602.1 |
| 57 | 57 | python-requests/2.21.0 |
| 57 | 57 | Mozilla/5.0 (Windows NT 10.0; WOW64; rv:49.0) Gecko/20100101 Firefox/49.0 |
| 57 | 57 | python-requests/2.18.4 |
| 57 | 57 | Mozilla/5.0 (Windows NT 10.0; Win64; x64) AppleWebKit/537.36 (KHTML, like Gecko) Chrome/53.0.2785.116 Safari/537.36 |
| 57 | 57 | Mozilla/5.0 (Macintosh; Intel Mac OS X 10_11_6) AppleWebKit/537.36 (KHTML, like Gecko) Chrome/53.0.2785.116 Safari/537.36 |
| 57 | 57 | Mozilla/5.0 (Windows NT 6.3; Trident/7.0; rv:11.0) like Gecko |
| 19 | 19 | https://gdnplus.com:Gather Analyze Provide. |
| 66 | 0 | [not listed: 2 browsers] |
(Go To: Top | General Summary | Monthly Report | Daily Summary | Hourly Summary | Domain Report | Organization Report | Failed Referrer Report | Browser Report | Browser Summary | Operating System Report | Status Code Report | File Size Report | File Type Report | Directory Report | Request Report)

Listing browsers with at least 1 request for a page, sorted by the number of requests for pages.
| # | #reqs | #pages | browser |
|---|---|---|---|
| 1 | 2139 | 1681 | Firefox |
| 1042 | 837 | Firefox/62 | |
| 460 | 460 | Firefox/58 | |
| 526 | 327 | Firefox/73 | |
| 57 | 57 | Firefox/49 | |
| 2 | 510 | 498 | Safari |
| 453 | 441 | Safari/537 | |
| 57 | 57 | Safari/602 | |
| 3 | 223 | 223 | Netscape (compatible) |
| 4 | 114 | 114 | python-requests |
| 114 | 114 | python-requests/2 | |
| 5 | 57 | 57 | Mozilla |
| 6 | 19 | 19 | https: |
| 19 | 19 | https://gdnplus |
(Go To: Top | General Summary | Monthly Report | Daily Summary | Hourly Summary | Domain Report | Organization Report | Failed Referrer Report | Browser Report | Browser Summary | Operating System Report | Status Code Report | File Size Report | File Type Report | Directory Report | Request Report)

Listing operating systems, sorted by the number of requests for pages.
| # | #reqs | #pages | OS |
|---|---|---|---|
| 1 | 1829 | 1624 | Unix |
| 1829 | 1624 | Linux | |
| 2 | 763 | 498 | Windows |
| 652 | 441 | Windows NT | |
| 57 | 57 | Unknown Windows | |
| 54 | 0 | Windows 2000 | |
| 3 | 356 | 356 | OS unknown |
| 4 | 114 | 114 | Macintosh |
(Go To: Top | General Summary | Monthly Report | Daily Summary | Hourly Summary | Domain Report | Organization Report | Failed Referrer Report | Browser Report | Browser Summary | Operating System Report | Status Code Report | File Size Report | File Type Report | Directory Report | Request Report)
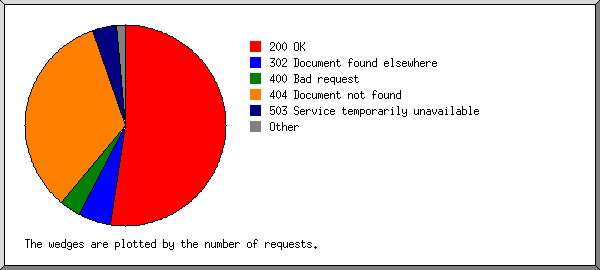
Listing status codes, sorted numerically.
| #reqs | status code |
|---|---|
| 3015 | 200 OK |
| 724 | 301 Document moved permanently |
| 47 | 304 Not modified since last retrieval |
| 4697 | 400 Bad request |
| 301 | 401 Authentication required |
| 6848 | 404 Document not found |
| 48 | 500 Internal server error |
| 1984 | 503 Service temporarily unavailable |
(Go To: Top | General Summary | Monthly Report | Daily Summary | Hourly Summary | Domain Report | Organization Report | Failed Referrer Report | Browser Report | Browser Summary | Operating System Report | Status Code Report | File Size Report | File Type Report | Directory Report | Request Report)

| size | #reqs | %bytes |
|---|---|---|
| 0 | 161 | |
| 1B- 10B | 0 | |
| 11B- 100B | 6 | |
| 101B- 1kB | 665 | 0.83% |
| 1kB- 10kB | 141 | 0.27% |
| 10kB-100kB | 2089 | 98.90% |
(Go To: Top | General Summary | Monthly Report | Daily Summary | Hourly Summary | Domain Report | Organization Report | Failed Referrer Report | Browser Report | Browser Summary | Operating System Report | Status Code Report | File Size Report | File Type Report | Directory Report | Request Report)

Listing extensions with at least 0.1% of the traffic, sorted by the amount of traffic.
| #reqs | %bytes | extension |
|---|---|---|
| 2592 | 78.75% | [directories] |
| 211 | 12.93% | .php [PHP] |
| 147 | 6.21% | [no extension] |
| 53 | 1.05% | .applelama |
| 53 | 1.05% | .env |
| 6 | [not listed: 1 extension] |
(Go To: Top | General Summary | Monthly Report | Daily Summary | Hourly Summary | Domain Report | Organization Report | Failed Referrer Report | Browser Report | Browser Summary | Operating System Report | Status Code Report | File Size Report | File Type Report | Directory Report | Request Report)
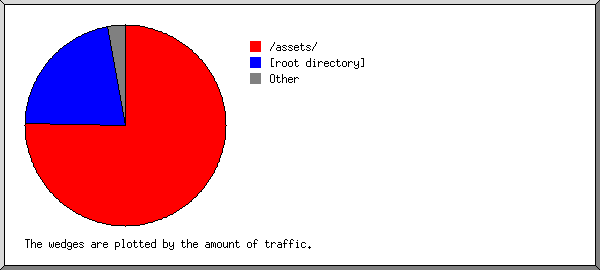
Listing directories with at least 0.01% of the traffic, sorted by the amount of traffic.
| #reqs | %bytes | directory |
|---|---|---|
| 2101 | 41.10% | [root directory] |
| 166 | 10.17% | /magento/ |
| 166 | 10.17% | /store/ |
| 166 | 10.17% | /shop/ |
| 123 | 7.54% | /magento2/ |
| 43 | 2.64% | /staging/ |
| 43 | 2.64% | /demo/ |
| 43 | 2.64% | /test/ |
| 43 | 2.64% | /old/ |
| 43 | 2.64% | /dev/ |
| 43 | 2.64% | /index.php/ |
| 41 | 2.51% | /pub/ |
| 41 | 2.51% | /admin/ |
(Go To: Top | General Summary | Monthly Report | Daily Summary | Hourly Summary | Domain Report | Organization Report | Failed Referrer Report | Browser Report | Browser Summary | Operating System Report | Status Code Report | File Size Report | File Type Report | Directory Report | Request Report)

Listing files with at least 20 requests, sorted by the number of requests.
| #reqs | %bytes | last time | file |
|---|---|---|---|
| 1836 | 32.42% | Apr/ 8/20 5:08 AM | / |
| 60 | 0.33% | Mar/31/20 11:49 PM | /?38.131.154.94 |
| 16 | 0.98% | Mar/31/20 11:49 PM | /?193.37.253.106 |
| 93 | 5.17% | Feb/25/20 5:22 PM | /cpanel |
| 54 | 1.04% | Feb/18/20 12:43 AM | /dasdasd |
| 53 | 1.05% | Mar/15/20 7:59 AM | /.env.applelama |
| 53 | 1.05% | Mar/15/20 7:59 AM | /.env |
| 43 | 2.64% | Mar/ 5/20 6:15 PM | /store/index.php/admin/ |
| 43 | 2.64% | Mar/ 5/20 6:15 PM | /dev/index.php/admin/ |
| 43 | 2.64% | Mar/ 5/20 6:15 PM | /test/index.php/admin/ |
| 43 | 2.64% | Mar/ 5/20 6:15 PM | /index.php/admin/ |
| 43 | 2.64% | Mar/ 5/20 6:15 PM | /shop/index.php/admin/ |
| 43 | 2.64% | Mar/ 5/20 6:15 PM | /old/index.php/admin/ |
| 43 | 2.64% | Mar/ 5/20 6:15 PM | /staging/index.php/admin/ |
| 43 | 2.64% | Mar/ 5/20 6:15 PM | /demo/index.php/admin/ |
| 43 | 2.64% | Mar/ 5/20 6:15 PM | /magento/index.php/admin/ |
| 41 | 2.51% | Mar/ 8/20 3:32 AM | /shop/pub/errors/503.php |
| 41 | 2.51% | Mar/ 8/20 3:32 AM | /magento2/admin/ |
| 41 | 2.51% | Mar/ 8/20 3:32 AM | /magento2/ |
| 41 | 2.51% | Mar/ 8/20 3:32 AM | /admin/ |
| 41 | 2.51% | Mar/ 8/20 3:32 AM | /magento2/pub/errors/503.php |
| 41 | 2.51% | Mar/ 8/20 3:32 AM | /shop/ |
| 41 | 2.51% | Mar/ 8/20 3:32 AM | /pub/errors/503.php |
| 41 | 2.51% | Mar/ 8/20 3:32 AM | /magento/admin/ |
| 41 | 2.51% | Mar/ 8/20 3:32 AM | /store/admin/ |
| 41 | 2.51% | Mar/ 8/20 3:32 AM | /magento/ |
| 41 | 2.51% | Mar/ 8/20 3:32 AM | /store/ |
| 41 | 2.51% | Mar/ 8/20 3:32 AM | /shop/admin/ |
| 41 | 2.51% | Mar/ 8/20 3:32 AM | /magento/pub/errors/503.php |
| 41 | 2.51% | Mar/ 8/20 3:32 AM | /store/pub/errors/503.php |
| 12 | 0.37% | Mar/26/20 10:37 PM | [not listed: 2 files] |