(Go To: Top | General Summary | Monthly Report | Daily Summary | Hourly Summary | Domain Report | Organization Report | Redirected Referrer Report | Failed Referrer Report | Referring Site Report | Browser Report | Browser Summary | Operating System Report | Status Code Report | File Size Report | File Type Report | Directory Report | Request Report)
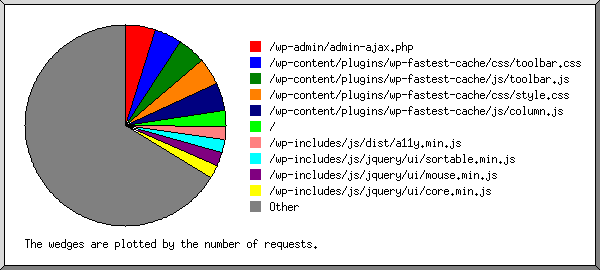
Listing files with at least 20 requests, sorted by the number of requests.
| #reqs | %bytes | last time | file |
|---|
| 51 | 6.76% | Apr/20/22 11:54 PM | /wp-admin/admin-ajax.php |
| 45 | 1.98% | Apr/20/22 11:48 PM | /wp-content/plugins/wp-fastest-cache/css/toolbar.css |
| 45 | 0.48% | Apr/20/22 11:48 PM | /wp-content/plugins/wp-fastest-cache/js/toolbar.js |
| 45 | 2.88% | Apr/20/22 11:48 PM | /wp-content/plugins/wp-fastest-cache/css/style.css |
| 45 | 0.22% | Apr/20/22 11:48 PM | /wp-content/plugins/wp-fastest-cache/js/column.js |
| 25 | 6.08% | May/19/22 9:50 AM | / |
| 22 | 0.03% | Apr/20/22 11:52 PM | /wp-includes/js/dist/a11y.min.js |
| 20 | 0.01% | Apr/20/22 11:52 PM | /wp-includes/js/dist/a11y.min.js?ver=68e470cf840f69530e9db3be229ad4b6 |
| 22 | 0.19% | Apr/20/22 11:52 PM | /wp-includes/js/jquery/ui/sortable.min.js |
| 20 | 0.06% | Apr/20/22 11:52 PM | /wp-includes/js/jquery/ui/sortable.min.js?ver=1.13.1 |
| 22 | 0.03% | Apr/20/22 11:52 PM | /wp-includes/js/jquery/ui/mouse.min.js |
| 20 | 0.01% | Apr/20/22 11:52 PM | /wp-includes/js/jquery/ui/mouse.min.js?ver=1.13.1 |
| 22 | 0.20% | Apr/20/22 11:52 PM | /wp-includes/js/jquery/ui/core.min.js |
| 20 | 0.07% | Apr/20/22 11:52 PM | /wp-includes/js/jquery/ui/core.min.js?ver=1.13.1 |
| 22 | 0.77% | Apr/20/22 11:52 PM | /wp-includes/js/media-views.min.js |
| 20 | 0.26% | Apr/20/22 11:52 PM | /wp-includes/js/media-views.min.js?ver=5.9.3 |
| 22 | 0.11% | Apr/20/22 11:52 PM | /wp-includes/js/dist/i18n.min.js |
| 20 | 0.04% | Apr/20/22 11:52 PM | /wp-includes/js/dist/i18n.min.js?ver=30fcecb428a0e8383d3776bcdd3a7834 |
| 631 | 80.26% | Apr/20/22 11:54 PM | [not listed: 271 files] |
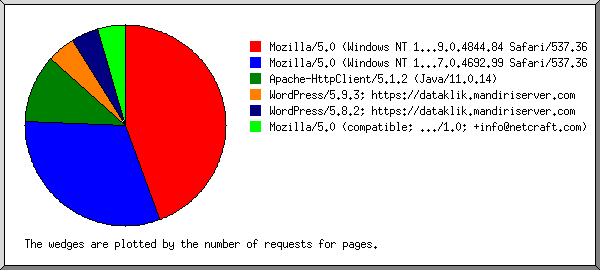
 Web Server Statistics for dataklik.mandiriserver.com
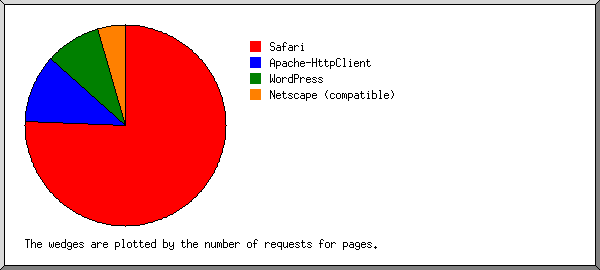
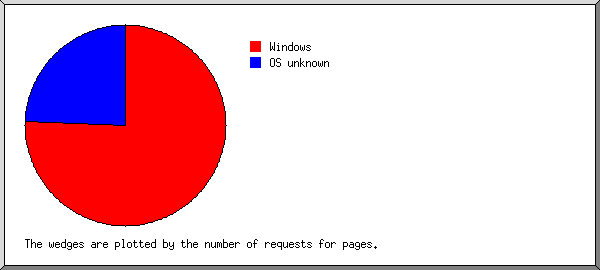
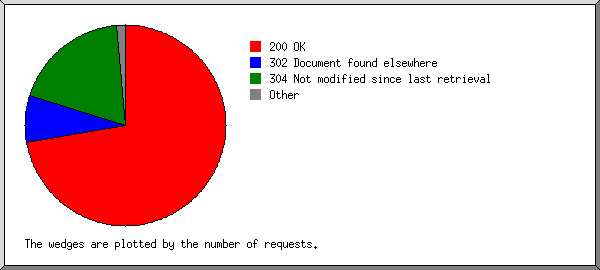
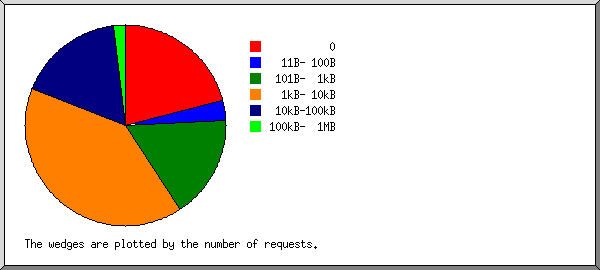
 ) represents 1 request for a page.