 Web Server Statistics for kaze.solusitotal.com
Program started on Mon, Aug 31 2020 at 7:43 PM.
Analyzed requests from Sun, Dec 11 2016 at 3:45 AM to Mon, Aug 31 2020 at 6:30 PM (1359.61 days).
Web Server Statistics for kaze.solusitotal.comProgram started on Mon, Aug 31 2020 at 7:43 PM.
Analyzed requests from Sun, Dec 11 2016 at 3:45 AM to Mon, Aug 31 2020 at 6:30 PM (1359.61 days).
(Go To: Top | General Summary | Monthly Report | Daily Summary | Hourly Summary | Domain Report | Organization Report | Failed Referrer Report | Browser Report | Browser Summary | Operating System Report | Status Code Report | File Size Report | File Type Report | Directory Report | Request Report)
Figures in parentheses refer to the 7-day period ending Aug 31 2020 at 7:43 PM.
Successful requests: 15,960 (11)
Average successful requests per day: 11 (1)
Successful requests for pages: 14,363 (11)
Average successful requests for pages per day: 10 (1)
Failed requests: 11,807 (1)
Distinct files requested: 16 (107)
Distinct hosts served: 340 (439)
Data transferred: 226.49 megabytes (107.09 kilobytes)
Average data transferred per day: 170.58 kilobytes (15.30 kilobytes)
(Go To: Top | General Summary | Monthly Report | Daily Summary | Hourly Summary | Domain Report | Organization Report | Failed Referrer Report | Browser Report | Browser Summary | Operating System Report | Status Code Report | File Size Report | File Type Report | Directory Report | Request Report)
Each unit ( ) represents 80 requests for pages or part thereof.
| month | #reqs | #pages | |
|---|---|---|---|
| Dec 2016 | 492 | 492 |   |
| Jan 2017 | 533 | 533 | |
| Feb 2017 | 410 | 369 | |
| Mar 2017 | 369 | 369 | |
| Apr 2017 | 410 | 410 | |
| May 2017 | 533 | 533 | |
| Jun 2017 | 123 | 123 | |
| Jul 2017 | 123 | 123 | |
| Aug 2017 | 123 | 123 | |
| Sep 2017 | 123 | 123 | |
| Oct 2017 | 123 | 123 | |
| Nov 2017 | 123 | 123 | |
| Dec 2017 | 246 | 246 | |
| Jan 2018 | 123 | 123 | |
| Feb 2018 | 123 | 123 | |
| Mar 2018 | 123 | 123 | |
| Apr 2018 | 246 | 246 | |
| May 2018 | 123 | 123 | |
| Jun 2018 | 123 | 123 | |
| Jul 2018 | 123 | 123 | |
| Aug 2018 | 123 | 123 | |
| Sep 2018 | 123 | 123 | |
| Oct 2018 | 123 | 123 | |
| Nov 2018 | 123 | 123 | |
| Dec 2018 | 0 | 0 | |
| Jan 2019 | 123 | 123 | |
| Feb 2019 | 123 | 123 | |
| Mar 2019 | 246 | 246 | |
| Apr 2019 | 123 | 123 | |
| May 2019 | 123 | 123 | |
| Jun 2019 | 123 | 123 | |
| Jul 2019 | 246 | 246 | |
| Aug 2019 | 123 | 123 | |
| Sep 2019 | 246 | 246 | |
| Oct 2019 | 246 | 246 | |
| Nov 2019 | 794 | 640 |  |
| Dec 2019 | 360 | 298 | |
| Jan 2020 | 298 | 284 | |
| Feb 2020 | 1056 | 1022 | |
| Mar 2020 | 596 | 473 | |
| Apr 2020 | 2775 | 2775 |  |
| May 2020 | 920 | 796 | |
| Jun 2020 | 178 | 178 | |
| Jul 2020 | 230 | 224 | |
| Aug 2020 | 1824 | 785 | |
Busiest month: Apr 2020 (2,775 requests for pages).
(Go To: Top | General Summary | Monthly Report | Daily Summary | Hourly Summary | Domain Report | Organization Report | Failed Referrer Report | Browser Report | Browser Summary | Operating System Report | Status Code Report | File Size Report | File Type Report | Directory Report | Request Report)
Each unit () represents 100 requests for pages or part thereof.
| day | #reqs | #pages | |
|---|---|---|---|
| Sun | 1711 | 1604 |  |
| Mon | 1538 | 1493 | |
| Tue | 3871 | 3681 | |
| Wed | 2724 | 2066 | |
| Thu | 2259 | 2018 | |
| Fri | 1231 | 1122 | |
| Sat | 2626 | 2379 | |
(Go To: Top | General Summary | Monthly Report | Daily Summary | Hourly Summary | Domain Report | Organization Report | Failed Referrer Report | Browser Report | Browser Summary | Operating System Report | Status Code Report | File Size Report | File Type Report | Directory Report | Request Report)
Each unit () represents 30 requests for pages or part thereof.
| hour | #reqs | #pages | |
|---|---|---|---|
| 0 | 567 | 567 | |
| 1 | 147 | 124 | |
| 2 | 527 | 369 | |
| 3 | 421 | 389 | |
| 4 | 766 | 760 | |
| 5 | 804 | 772 | |
| 6 | 566 | 519 | |
| 7 | 780 | 780 | |
| 8 | 656 | 525 | |
| 9 | 664 | 664 | |
| 10 | 357 | 269 | |
| 11 | 345 | 345 | |
| 12 | 361 | 233 | |
| 13 | 913 | 872 | |
| 14 | 1090 | 1062 | |
| 15 | 508 | 503 | |
| 16 | 878 | 743 | |
| 17 | 790 | 730 | |
| 18 | 753 | 679 | |
| 19 | 866 | 322 | |
| 20 | 407 | 371 | |
| 21 | 1026 | 1026 | |
| 22 | 962 | 962 | |
| 23 | 806 | 777 | |
(Go To: Top | General Summary | Monthly Report | Daily Summary | Hourly Summary | Domain Report | Organization Report | Failed Referrer Report | Browser Report | Browser Summary | Operating System Report | Status Code Report | File Size Report | File Type Report | Directory Report | Request Report)
Listing domains, sorted by the amount of traffic.
| #reqs | %bytes | domain |
|---|---|---|
| 15960 | 100% | [unresolved numerical addresses] |
(Go To: Top | General Summary | Monthly Report | Daily Summary | Hourly Summary | Domain Report | Organization Report | Failed Referrer Report | Browser Report | Browser Summary | Operating System Report | Status Code Report | File Size Report | File Type Report | Directory Report | Request Report)

Listing the top 20 organizations by the number of requests, sorted by the number of requests.
| #reqs | %bytes | organization |
|---|---|---|
| 3220 | 29.67% | 209.17 |
| 1875 | 10.24% | 104 |
| 1029 | 4.58% | 138.197 |
| 940 | 4.22% | 45 |
| 903 | 5.20% | 159.203 |
| 826 | 4.22% | 165.227 |
| 788 | 11.08% | 93 |
| 659 | 3.12% | 167.71 |
| 619 | 3.10% | 174.138 |
| 462 | 0.01% | 66.249 |
| 369 | 1.55% | 159.65 |
| 358 | 2.45% | 142.93 |
| 302 | 2.67% | 167.172 |
| 278 | 1.52% | 68.183 |
| 260 | 1.32% | 163.172 |
| 253 | 1.31% | 157.245 |
| 208 | 1.39% | 134.209 |
| 205 | 0.92% | 193.171 |
| 185 | 0.84% | 131.220 |
| 164 | 0.69% | 159.89 |
| 2057 | 9.90% | [not listed: 33 organizations] |
(Go To: Top | General Summary | Monthly Report | Daily Summary | Hourly Summary | Domain Report | Organization Report | Failed Referrer Report | Browser Report | Browser Summary | Operating System Report | Status Code Report | File Size Report | File Type Report | Directory Report | Request Report)
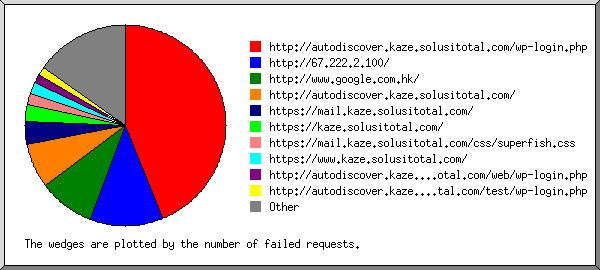
Listing referring URLs, sorted by the number of failed requests.
(Go To: Top | General Summary | Monthly Report | Daily Summary | Hourly Summary | Domain Report | Organization Report | Failed Referrer Report | Browser Report | Browser Summary | Operating System Report | Status Code Report | File Size Report | File Type Report | Directory Report | Request Report)
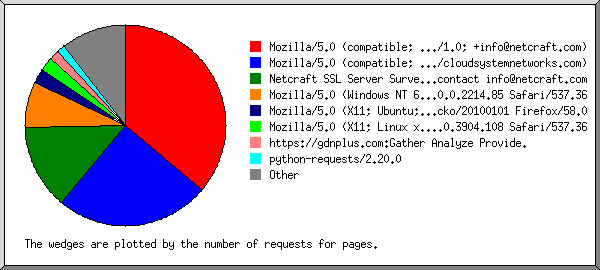
Listing browsers with at least 1 request for a page, sorted by the number of requests for pages.
| #reqs | #pages | browser |
|---|---|---|
| 5998 | 5998 | Mozilla/5.0 (compatible; NetcraftSurveyAgent/1.0; [email protected]) |
| 3220 | 3220 | Mozilla/5.0 (compatible; Nimbostratus-Bot/v1.3.2; http://cloudsystemnetworks.com) |
| 2706 | 2706 | Netcraft SSL Server Survey - contact [email protected] |
| 403 | 403 | Mozilla/5.0 (X11; Linux x86_64) AppleWebKit/537.36 (KHTML, like Gecko) Chrome/78.0.3904.108 Safari/537.36 |
| 312 | 312 | https://gdnplus.com:Gather Analyze Provide. |
| 290 | 290 | Mozilla/5.0 (X11; Ubuntu; Linux x86_64; rv:58.0) Gecko/20100101 Firefox/58.0 |
| 287 | 287 | python-requests/2.20.0 |
| 185 | 185 | Mozilla/5.0 (X11; Linux x86_64) AppleWebKit/537.36 (KHTML, like Gecko) Chrome/79.0.3945.79 Safari/537.36 |
| 91 | 91 | Mozilla/5.0 (Macintosh; Intel Mac OS X 10.12; rv:55.0) Gecko/20100101 Firefox/55.0 |
| 89 | 89 | Mozilla/5.0 |
| 71 | 71 | Mozilla/5.0 (Windows NT 6.1; Win64; x64) AppleWebKit/537.36 (KHTML, like Gecko) Chrome/40.0.2214.85 Safari/537.36 |
| 67 | 67 | Mozilla/5.0 (Windows NT 10.0; WOW64; rv:49.0) Gecko/20100101 Firefox/49.0 |
| 67 | 67 | Mozilla/5.0 (Windows NT 6.3; Trident/7.0; rv:11.0) like Gecko |
| 66 | 66 | Mozilla/5.0 (Linux; Android 6.0.1; Nexus 6P Build/MMB29P) AppleWebKit/537.36 (KHTML, like Gecko) Chrome/44.0.2403.133 Mobile Safari/537.36 |
| 59 | 59 | Mozilla/5.0 (X11; Ubuntu; Linux x86_64; rv:62.0) Gecko/20100101 Firefox/62.0 |
| 58 | 58 | Mozilla/5.0 (Windows NT 6.1; WOW64; rv:31.0) Gecko/20130401 Firefox/31.0 |
| 51 | 51 | Mozilla/5.0 zgrab/0.x |
| 38 | 38 | python-requests/2.21.0 |
| 35 | 35 | Mozilla/5.0 (Linux; Android 7.1.1; Nexus 6P Build/NOF27C) AppleWebKit/537.36 (KHTML, like Gecko) Chrome/61.0.3163.81 Mobile Safari/537.36 |
| 35 | 35 | Mozilla/5.0 (iPhone; CPU iPhone OS 10_2_1 like Mac OS X) AppleWebKit/602.4.6 (KHTML, like Gecko) Version/10.0 Mobile/14D27 Safari/602.1 |
| 35 | 35 | Mozilla/5.0 (Windows NT 6.1; WOW64) AppleWebKit/537.36 (KHTML, like Gecko) Chrome/53.0.2785.143 Safari/537.36 |
| 33 | 33 | Mozilla/5.0 (Macintosh; Intel Mac OS X 10.11; rv:47.0) Gecko/20100101 Firefox/47.0 |
| 32 | 32 | Mozilla/5.0 (iPad; CPU OS 10_3_3 like Mac OS X) AppleWebKit/603.3.8 (KHTML, like Gecko) Version/10.0 Mobile/14G60 Safari/602.1 |
| 32 | 32 | python-requests/2.18.4 |
| 32 | 32 | Mozilla/5.0 (Windows NT 10.0; Win64; x64) AppleWebKit/537.36 (KHTML, like Gecko) Chrome/53.0.2785.116 Safari/537.36 |
| 52 | 26 | Mozilla/5.0 (Windows NT 10.0; Win64; x64) AppleWebKit/537.36 (KHTML, like Gecko) Chrome/79.0.3945.79 Safari/537.36 |
| 23 | 23 | Mozilla/5.0 (Macintosh; Intel Mac OS X 10_12_6) AppleWebKit/537.36 (KHTML, like Gecko) Chrome/60.0.3112.113 Safari/537.36 |
| 16 | 16 | Mozilla/5.0 (iPad; CPU OS 6_0 like Mac OS X) AppleWebKit/536.26 (KHTML, like Gecko) Version/6.0 Mobile/10A5355d Safari/8536.25 |
| 6 | 6 | python-requests/2.22.0 |
| 919 | 0 | [not listed: 11 browsers] |
(Go To: Top | General Summary | Monthly Report | Daily Summary | Hourly Summary | Domain Report | Organization Report | Failed Referrer Report | Browser Report | Browser Summary | Operating System Report | Status Code Report | File Size Report | File Type Report | Directory Report | Request Report)

Listing browsers with at least 1 request for a page, sorted by the number of requests for pages.
| # | #reqs | #pages | browser |
|---|---|---|---|
| 1 | 9680 | 9218 | Netscape (compatible) |
| 2 | 2706 | 2706 | Netcraft SSL Server Survey - contact [email protected] |
| 3 | 1071 | 959 | Safari |
| 988 | 876 | Safari/537 | |
| 67 | 67 | Safari/602 | |
| 16 | 16 | Safari/8536 | |
| 4 | 764 | 598 | Firefox |
| 290 | 290 | Firefox/58 | |
| 91 | 91 | Firefox/55 | |
| 67 | 67 | Firefox/49 | |
| 59 | 59 | Firefox/62 | |
| 58 | 58 | Firefox/31 | |
| 33 | 33 | Firefox/47 | |
| 5 | 363 | 363 | python-requests |
| 363 | 363 | python-requests/2 | |
| 6 | 312 | 312 | https: |
| 312 | 312 | https://gdnplus | |
| 7 | 207 | 207 | Mozilla |
| 205 | 0 | [not listed: 4 browsers] |
(Go To: Top | General Summary | Monthly Report | Daily Summary | Hourly Summary | Domain Report | Organization Report | Failed Referrer Report | Browser Report | Browser Summary | Operating System Report | Status Code Report | File Size Report | File Type Report | Directory Report | Request Report)

Listing operating systems, sorted by the number of requests for pages.
| # | #reqs | #pages | OS |
|---|---|---|---|
| 1 | 13338 | 12739 | OS unknown |
| 2 | 1038 | 1038 | Unix |
| 1038 | 1038 | Linux | |
| 3 | 671 | 356 | Windows |
| 299 | 231 | Unknown Windows | |
| 335 | 125 | Windows NT | |
| 37 | 0 | Windows XP | |
| 4 | 261 | 230 | Macintosh |
(Go To: Top | General Summary | Monthly Report | Daily Summary | Hourly Summary | Domain Report | Organization Report | Failed Referrer Report | Browser Report | Browser Summary | Operating System Report | Status Code Report | File Size Report | File Type Report | Directory Report | Request Report)

Listing status codes, sorted numerically.
| #reqs | status code |
|---|---|
| 15960 | 200 OK |
| 4257 | 400 Bad request |
| 3578 | 404 Document not found |
| 3972 | 503 Service temporarily unavailable |
(Go To: Top | General Summary | Monthly Report | Daily Summary | Hourly Summary | Domain Report | Organization Report | Failed Referrer Report | Browser Report | Browser Summary | Operating System Report | Status Code Report | File Size Report | File Type Report | Directory Report | Request Report)
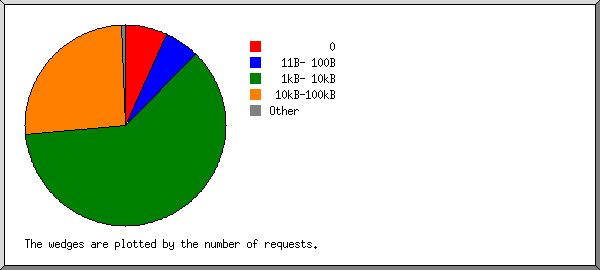
| size | #reqs | %bytes |
|---|---|---|
| 0 | 191 | |
| 1B- 10B | 0 | |
| 11B- 100B | 519 | 0.01% |
| 101B- 1kB | 0 | |
| 1kB- 10kB | 11031 | 46.30% |
| 10kB-100kB | 4219 | 53.69% |
(Go To: Top | General Summary | Monthly Report | Daily Summary | Hourly Summary | Domain Report | Organization Report | Failed Referrer Report | Browser Report | Browser Summary | Operating System Report | Status Code Report | File Size Report | File Type Report | Directory Report | Request Report)
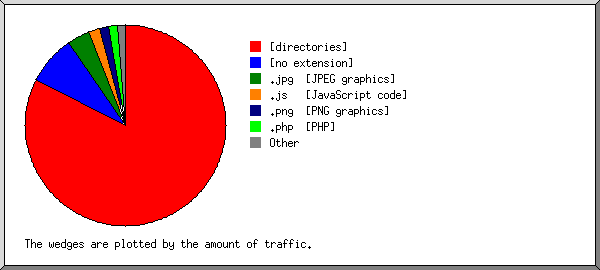
Listing extensions with at least 0.1% of the traffic, sorted by the amount of traffic.
| #reqs | %bytes | extension |
|---|---|---|
| 14363 | 87.15% | [directories] |
| 884 | 11.81% | [no extension] |
| 26 | 0.41% | .php [PHP] |
| 49 | 0.25% | .applelama |
| 49 | 0.25% | .env |
| 26 | 0.13% | .ico |
| 563 | 0.01% | [not listed: 1 extension] |
(Go To: Top | General Summary | Monthly Report | Daily Summary | Hourly Summary | Domain Report | Organization Report | Failed Referrer Report | Browser Report | Browser Summary | Operating System Report | Status Code Report | File Size Report | File Type Report | Directory Report | Request Report)
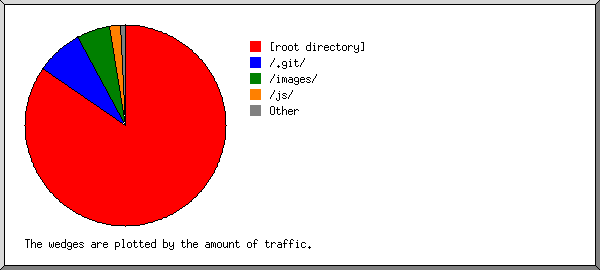
Listing directories with at least 0.01% of the traffic, sorted by the amount of traffic.
| #reqs | %bytes | directory |
|---|---|---|
| 15160 | 88.37% | [root directory] |
| 748 | 11.14% | /.git/ |
| 23 | 0.36% | /adminer/ |
| 29 | 0.12% | /index.php/ |
(Go To: Top | General Summary | Monthly Report | Daily Summary | Hourly Summary | Domain Report | Organization Report | Failed Referrer Report | Browser Report | Browser Summary | Operating System Report | Status Code Report | File Size Report | File Type Report | Directory Report | Request Report)
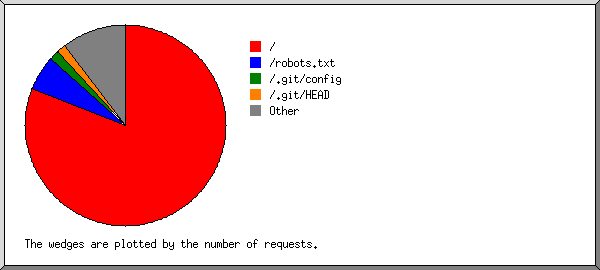
Listing files with at least 20 requests, sorted by the number of requests.
| #reqs | %bytes | last time | file |
|---|---|---|---|
| 14334 | 87.02% | Aug/30/20 10:41 PM | / |
| 35 | 0.16% | Mar/31/20 7:47 PM | /?159.203.116.182 |
| 27 | 0.11% | Feb/ 1/20 12:33 AM | /?159.65.241.104 |
| 26 | 0.11% | Feb/ 1/20 12:33 AM | /?45.55.49.231 |
| 26 | 0.11% | Jul/31/20 4:15 PM | /?74.207.241.29 |
| 563 | 0.01% | Aug/20/20 12:39 PM | /robots.txt |
| 60 | Aug/ 2/20 8:46 AM | /robots.txt?74.207.241.29 | |
| 400 | 5.59% | Aug/15/20 2:57 AM | /.git/config |
| 348 | 5.56% | Aug/18/20 1:00 AM | /.git/HEAD |
| 136 | 0.67% | Dec/12/19 10:23 AM | /dasdasd |
| 49 | 0.25% | Mar/14/20 8:04 AM | /.env.applelama |
| 49 | 0.25% | Mar/14/20 8:04 AM | /.env |
| 29 | 0.12% | Dec/18/19 1:43 AM | /index.php/admin/ |
| 26 | 0.13% | May/25/20 10:44 AM | /favicon.ico |
| 23 | 0.36% | May/19/20 8:35 AM | /adminer/index.php |
| 3 | 0.05% | Mar/27/20 4:27 AM | [not listed: 1 file] |