Web Server Statistics for logtik.kliklogistics.co.idProgram started on Tue, Dec 31 2019 at 3:33 PM.
Analyzed requests from Tue, Dec 17 2019 at 4:20 AM to Tue, Dec 31 2019 at 12:34 PM (14.34 days).
(Go To: Top | General Summary | Monthly Report | Daily Summary | Hourly Summary | Domain Report | Organization Report | Referring Site Report | Browser Report | Browser Summary | Operating System Report | Status Code Report | File Size Report | File Type Report | Directory Report | Request Report)
Figures in parentheses refer to the 7-day period ending Dec 31 2019 at 3:33 PM.
Successful requests: 629 (49)
Average successful requests per day: 43 (6)
Failed requests: 44 (0)
Redirected requests: 1,283 (1)
Distinct files requested: 18 (33)
Distinct hosts served: 10 (41)
Data transferred: 1.15 megabytes (1.14 kilobytes)
Average data transferred per day: 81.92 kilobytes (167 bytes)
(Go To: Top | General Summary | Monthly Report | Daily Summary | Hourly Summary | Domain Report | Organization Report | Referring Site Report | Browser Report | Browser Summary | Operating System Report | Status Code Report | File Size Report | File Type Report | Directory Report | Request Report)
Each unit (
) represents 1 request for a page.
| month | #reqs | #pages | |
|---|---|---|---|
| Dec 2019 | 629 | 0 |
Busiest month: Dec 2019 (0 requests for pages).
(Go To: Top | General Summary | Monthly Report | Daily Summary | Hourly Summary | Domain Report | Organization Report | Referring Site Report | Browser Report | Browser Summary | Operating System Report | Status Code Report | File Size Report | File Type Report | Directory Report | Request Report)
Each unit (
) represents 1 request for a page.
| day | #reqs | #pages | |
|---|---|---|---|
| Sun | 30 | 0 | |
| Mon | 21 | 0 | |
| Tue | 331 | 0 | |
| Wed | 105 | 0 | |
| Thu | 32 | 0 | |
| Fri | 83 | 0 | |
| Sat | 27 | 0 |
(Go To: Top | General Summary | Monthly Report | Daily Summary | Hourly Summary | Domain Report | Organization Report | Referring Site Report | Browser Report | Browser Summary | Operating System Report | Status Code Report | File Size Report | File Type Report | Directory Report | Request Report)
Each unit (
) represents 1 request for a page.
| hour | #reqs | #pages | |
|---|---|---|---|
| 0 | 0 | 0 | |
| 1 | 20 | 0 | |
| 2 | 20 | 0 | |
| 3 | 78 | 0 | |
| 4 | 342 | 0 | |
| 5 | 0 | 0 | |
| 6 | 12 | 0 | |
| 7 | 0 | 0 | |
| 8 | 0 | 0 | |
| 9 | 54 | 0 | |
| 10 | 0 | 0 | |
| 11 | 0 | 0 | |
| 12 | 0 | 0 | |
| 13 | 0 | 0 | |
| 14 | 0 | 0 | |
| 15 | 16 | 0 | |
| 16 | 16 | 0 | |
| 17 | 0 | 0 | |
| 18 | 0 | 0 | |
| 19 | 14 | 0 | |
| 20 | 14 | 0 | |
| 21 | 18 | 0 | |
| 22 | 3 | 0 | |
| 23 | 22 | 0 |
(Go To: Top | General Summary | Monthly Report | Daily Summary | Hourly Summary | Domain Report | Organization Report | Referring Site Report | Browser Report | Browser Summary | Operating System Report | Status Code Report | File Size Report | File Type Report | Directory Report | Request Report)
Listing domains, sorted by the amount of traffic.
| #reqs | %bytes | domain |
|---|---|---|
| 629 | 100% | [unresolved numerical addresses] |
(Go To: Top | General Summary | Monthly Report | Daily Summary | Hourly Summary | Domain Report | Organization Report | Referring Site Report | Browser Report | Browser Summary | Operating System Report | Status Code Report | File Size Report | File Type Report | Directory Report | Request Report)

Listing organizations, sorted by the number of requests.
| #reqs | %bytes | organization |
|---|---|---|
| 388 | 1.87% | 67.222 |
| 66 | 0.46% | 91 |
| 51 | 32.47% | 118 |
| 38 | 24.04% | 66.102 |
| 30 | 18.98% | 51 |
| 19 | 12.02% | 66.249 |
| 16 | 10.12% | 62.210 |
| 14 | 0.03% | 40 |
| 7 | 0.02% | 207.46 |
(Go To: Top | General Summary | Monthly Report | Daily Summary | Hourly Summary | Domain Report | Organization Report | Referring Site Report | Browser Report | Browser Summary | Operating System Report | Status Code Report | File Size Report | File Type Report | Directory Report | Request Report)
Listing referring sites, sorted by the number of requests.
| #reqs | site |
|---|---|
| 124 | http://logtik.kliklogistics.co.id/ |
(Go To: Top | General Summary | Monthly Report | Daily Summary | Hourly Summary | Domain Report | Organization Report | Referring Site Report | Browser Report | Browser Summary | Operating System Report | Status Code Report | File Size Report | File Type Report | Directory Report | Request Report)
Listing browsers with at least 1 request for a page, sorted by the number of requests for pages.
| #reqs | #pages | browser |
|---|---|---|
| 629 | 0 | [not listed: 8 browsers] |
(Go To: Top | General Summary | Monthly Report | Daily Summary | Hourly Summary | Domain Report | Organization Report | Referring Site Report | Browser Report | Browser Summary | Operating System Report | Status Code Report | File Size Report | File Type Report | Directory Report | Request Report)
Listing browsers with at least 1 request for a page, sorted by the number of requests for pages.
| # | #reqs | #pages | browser |
|---|---|---|---|
| 629 | 0 | [not listed: 6 browsers] |
(Go To: Top | General Summary | Monthly Report | Daily Summary | Hourly Summary | Domain Report | Organization Report | Referring Site Report | Browser Report | Browser Summary | Operating System Report | Status Code Report | File Size Report | File Type Report | Directory Report | Request Report)
Listing operating systems, sorted by the number of requests for pages.
| # | #reqs | #pages | OS |
|---|---|---|---|
| 1 | 103 | 0 | Unix |
| 103 | 0 | Linux | |
| 2 | 14 | 0 | Known robots |
| 3 | 51 | 0 | Macintosh |
| 4 | 461 | 0 | OS unknown |
(Go To: Top | General Summary | Monthly Report | Daily Summary | Hourly Summary | Domain Report | Organization Report | Referring Site Report | Browser Report | Browser Summary | Operating System Report | Status Code Report | File Size Report | File Type Report | Directory Report | Request Report)

Listing status codes, sorted numerically.
| #reqs | status code |
|---|---|
| 629 | 200 OK |
| 985 | 301 Document moved permanently |
| 298 | 302 Document found elsewhere |
| 44 | 500 Internal server error |
(Go To: Top | General Summary | Monthly Report | Daily Summary | Hourly Summary | Domain Report | Organization Report | Referring Site Report | Browser Report | Browser Summary | Operating System Report | Status Code Report | File Size Report | File Type Report | Directory Report | Request Report)

| size | #reqs | %bytes |
|---|---|---|
| 0 | 0 | |
| 1B- 10B | 0 | |
| 11B- 100B | 475 | 2.38% |
| 101B- 1kB | 0 | |
| 1kB- 10kB | 154 | 97.62% |
(Go To: Top | General Summary | Monthly Report | Daily Summary | Hourly Summary | Domain Report | Organization Report | Referring Site Report | Browser Report | Browser Summary | Operating System Report | Status Code Report | File Size Report | File Type Report | Directory Report | Request Report)

Listing extensions with at least 0.1% of the traffic, sorted by the amount of traffic.
| #reqs | %bytes | extension |
|---|---|---|
| 154 | 97.62% | .cgi [CGI scripts] |
| 351 | 2.18% | .txt [Plain text] |
| 124 | 0.21% | .php [PHP] |
(Go To: Top | General Summary | Monthly Report | Daily Summary | Hourly Summary | Domain Report | Organization Report | Referring Site Report | Browser Report | Browser Summary | Operating System Report | Status Code Report | File Size Report | File Type Report | Directory Report | Request Report)

Listing directories with at least 0.01% of the traffic, sorted by the amount of traffic.
| #reqs | %bytes | directory |
|---|---|---|
| 154 | 97.62% | /cgi-sys/ |
| 330 | 2.13% | /.well-known/ |
| 145 | 0.26% | [root directory] |
(Go To: Top | General Summary | Monthly Report | Daily Summary | Hourly Summary | Domain Report | Organization Report | Referring Site Report | Browser Report | Browser Summary | Operating System Report | Status Code Report | File Size Report | File Type Report | Directory Report | Request Report)

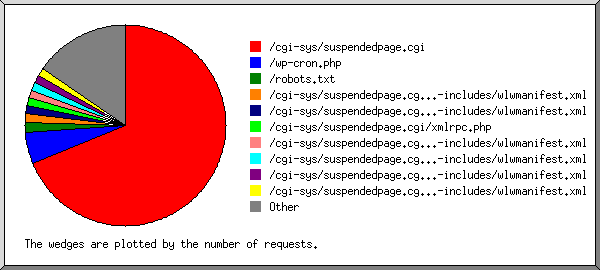
Listing files with at least 20 requests, sorted by the number of requests.
| #reqs | %bytes | last time | file |
|---|---|---|---|
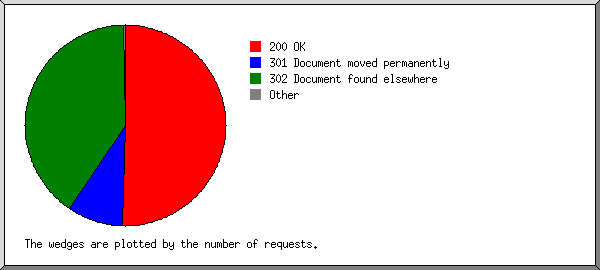
| 308 | 2.01% | Dec/17/19 4:23 AM | /.well-known/pki-validation/76FD166211DFD1FCF5CDF4980CF31019.txt |
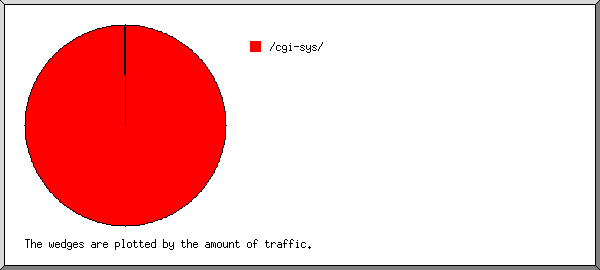
| 154 | 97.62% | Dec/21/19 8:19 PM | /cgi-sys/suspendedpage.cgi |
| 124 | 0.21% | Dec/31/19 9:36 AM | /wp-cron.php |
| 20 | 0.03% | Dec/18/19 2:08 AM | /wp-cron.php?doing_wp_cron=1576609708.0609040260314941406250 |
| 20 | 0.03% | Dec/18/19 1:59 AM | /wp-cron.php?doing_wp_cron=1576609149.2510640621185302734375 |
| 13 | 0.02% | Dec/21/19 11:41 PM | /wp-cron.php?doing_wp_cron=1576946498.3330640792846679687500 |
| 12 | 0.02% | Dec/22/19 4:41 AM | /wp-cron.php?doing_wp_cron=1576964514.7350978851318359375000 |
| 12 | 0.02% | Dec/22/19 6:20 AM | /wp-cron.php?doing_wp_cron=1576970429.7221829891204833984375 |
| 10 | 0.02% | Dec/23/19 9:42 PM | /wp-cron.php?doing_wp_cron=1577112176.1848011016845703125000 |
| 22 | 0.12% | Dec/17/19 4:23 AM | /.well-known/pki-validation/E86B1240E7A7619C4812EB6894B73DB3.txt |
| 21 | 0.05% | Dec/26/19 3:37 AM | /robots.txt |