 Web Server Statistics for pdamkabbanyuwangi.com
Program started on Tue, Jun 01 2021 at 7:46 PM.
Analyzed requests from Sun, Dec 04 2016 at 2:52 AM to Sat, Jul 15 2017 at 8:16 PM (223.72 days).
Web Server Statistics for pdamkabbanyuwangi.comProgram started on Tue, Jun 01 2021 at 7:46 PM.
Analyzed requests from Sun, Dec 04 2016 at 2:52 AM to Sat, Jul 15 2017 at 8:16 PM (223.72 days).
(Go To: Top | General Summary | Monthly Report | Daily Summary | Hourly Summary | Domain Report | Organization Report | Browser Report | Browser Summary | Operating System Report | Status Code Report | File Size Report | File Type Report | Directory Report | Request Report)
Successful requests: 104
Successful requests for pages: 33
Failed requests: 20
Redirected requests: 85
Distinct files requested: 6
Distinct hosts served: 48
Data transferred: 2.12 megabytes
Average data transferred per day: 9.71 kilobytes
(Go To: Top | General Summary | Monthly Report | Daily Summary | Hourly Summary | Domain Report | Organization Report | Browser Report | Browser Summary | Operating System Report | Status Code Report | File Size Report | File Type Report | Directory Report | Request Report)
Each unit ( ) represents 1 request for a page.
| month | #reqs | #pages | |
|---|---|---|---|
| Dec 2016 | 32 | 8 |  |
| Jan 2017 | 6 | 0 | |
| Feb 2017 | 2 | 0 | |
| Mar 2017 | 0 | 0 | |
| Apr 2017 | 15 | 13 |  |
| May 2017 | 28 | 12 | |
| Jun 2017 | 21 | 0 |
Busiest month: Apr 2017 (13 requests for pages).
(Go To: Top | General Summary | Monthly Report | Daily Summary | Hourly Summary | Domain Report | Organization Report | Browser Report | Browser Summary | Operating System Report | Status Code Report | File Size Report | File Type Report | Directory Report | Request Report)
Each unit () represents 1 request for a page.
| day | #reqs | #pages | |
|---|---|---|---|
| Sun | 18 | 9 | |
| Mon | 12 | 7 |  |
| Tue | 13 | 4 | |
| Wed | 11 | 5 | |
| Thu | 22 | 5 | |
| Fri | 10 | 0 | |
| Sat | 18 | 3 | |
(Go To: Top | General Summary | Monthly Report | Daily Summary | Hourly Summary | Domain Report | Organization Report | Browser Report | Browser Summary | Operating System Report | Status Code Report | File Size Report | File Type Report | Directory Report | Request Report)
Each unit () represents 1 request for a page.
| hour | #reqs | #pages | |
|---|---|---|---|
| 0 | 12 | 3 | |
| 1 | 3 | 2 | |
| 2 | 2 | 0 | |
| 3 | 5 | 5 | |
| 4 | 13 | 3 | |
| 5 | 7 | 4 | |
| 6 | 5 | 4 | |
| 7 | 9 | 3 | |
| 8 | 1 | 1 | |
| 9 | 4 | 0 | |
| 10 | 0 | 0 | |
| 11 | 6 | 1 | |
| 12 | 9 | 0 | |
| 13 | 2 | 0 | |
| 14 | 7 | 2 | |
| 15 | 3 | 1 | |
| 16 | 3 | 1 | |
| 17 | 6 | 2 | |
| 18 | 1 | 0 | |
| 19 | 0 | 0 | |
| 20 | 0 | 0 | |
| 21 | 0 | 0 | |
| 22 | 3 | 0 | |
| 23 | 3 | 1 | |
(Go To: Top | General Summary | Monthly Report | Daily Summary | Hourly Summary | Domain Report | Organization Report | Browser Report | Browser Summary | Operating System Report | Status Code Report | File Size Report | File Type Report | Directory Report | Request Report)
Listing domains, sorted by the amount of traffic.
| #reqs | %bytes | domain |
|---|---|---|
| 104 | 100% | [unresolved numerical addresses] |
(Go To: Top | General Summary | Monthly Report | Daily Summary | Hourly Summary | Domain Report | Organization Report | Browser Report | Browser Summary | Operating System Report | Status Code Report | File Size Report | File Type Report | Directory Report | Request Report)

Listing organizations, sorted by the number of requests.
| #reqs | %bytes | organization |
|---|---|---|
| 71 | 59.66% | 66.249 |
| 7 | 9.41% | 104 |
| 7 | 9.41% | 45 |
| 7 | 9.41% | 138.197 |
| 5 | 6.72% | 159.203 |
| 2 | 2.69% | 162.243 |
| 2 | 138.246 | |
| 2 | 2.69% | 174.138 |
| 1 | 129.78 |
(Go To: Top | General Summary | Monthly Report | Daily Summary | Hourly Summary | Domain Report | Organization Report | Browser Report | Browser Summary | Operating System Report | Status Code Report | File Size Report | File Type Report | Directory Report | Request Report)

Listing browsers with at least 1 request for a page, sorted by the number of requests for pages.
| #reqs | #pages | browser |
|---|---|---|
| 30 | 30 | Netcraft SSL Server Survey - contact [email protected] |
| 3 | 3 | Mozilla/5.0 (Windows NT 6.1; Win64; x64) AppleWebKit/537.36 (KHTML, like Gecko) Chrome/40.0.2214.85 Safari/537.36 |
| 71 | 0 | [not listed: 1 browser] |
(Go To: Top | General Summary | Monthly Report | Daily Summary | Hourly Summary | Domain Report | Organization Report | Browser Report | Browser Summary | Operating System Report | Status Code Report | File Size Report | File Type Report | Directory Report | Request Report)

Listing browsers with at least 1 request for a page, sorted by the number of requests for pages.
| # | #reqs | #pages | browser |
|---|---|---|---|
| 1 | 30 | 30 | Netcraft SSL Server Survey - contact [email protected] |
| 2 | 3 | 3 | Safari |
| 3 | 3 | Safari/537 | |
| 71 | 0 | [not listed: 1 browser] |
(Go To: Top | General Summary | Monthly Report | Daily Summary | Hourly Summary | Domain Report | Organization Report | Browser Report | Browser Summary | Operating System Report | Status Code Report | File Size Report | File Type Report | Directory Report | Request Report)

Listing operating systems, sorted by the number of requests for pages.
| # | #reqs | #pages | OS |
|---|---|---|---|
| 1 | 101 | 30 | OS unknown |
| 2 | 3 | 3 | Windows |
| 3 | 3 | Unknown Windows |
(Go To: Top | General Summary | Monthly Report | Daily Summary | Hourly Summary | Domain Report | Organization Report | Browser Report | Browser Summary | Operating System Report | Status Code Report | File Size Report | File Type Report | Directory Report | Request Report)
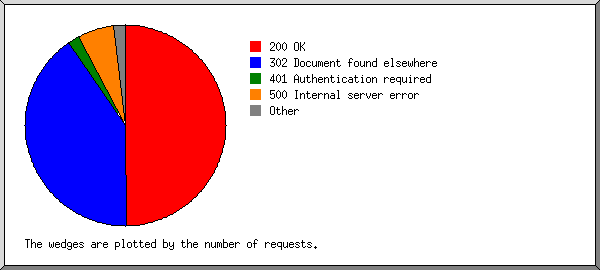
Listing status codes, sorted numerically.
| #reqs | status code |
|---|---|
| 104 | 200 OK |
| 85 | 302 Document found elsewhere |
| 2 | 400 Bad request |
| 4 | 401 Authentication required |
| 12 | 500 Internal server error |
| 2 | 503 Service temporarily unavailable |
(Go To: Top | General Summary | Monthly Report | Daily Summary | Hourly Summary | Domain Report | Organization Report | Browser Report | Browser Summary | Operating System Report | Status Code Report | File Size Report | File Type Report | Directory Report | Request Report)

| size | #reqs | %bytes |
|---|---|---|
| 0 | 3 | |
| 1B- 10B | 0 | |
| 11B- 100B | 7 | |
| 101B- 1kB | 6 | 0.24% |
| 1kB- 10kB | 27 | 8.87% |
| 10kB-100kB | 61 | 90.88% |
(Go To: Top | General Summary | Monthly Report | Daily Summary | Hourly Summary | Domain Report | Organization Report | Browser Report | Browser Summary | Operating System Report | Status Code Report | File Size Report | File Type Report | Directory Report | Request Report)

Listing extensions with at least 0.1% of the traffic, sorted by the amount of traffic.
| #reqs | %bytes | extension |
|---|---|---|
| 33 | 40.34% | [directories] |
| 21 | 37.57% | [no extension] |
| 10 | 12.98% | .json |
| 27 | 8.87% | .cgi [CGI scripts] |
| 13 | 0.25% | .txt [Plain text] |
(Go To: Top | General Summary | Monthly Report | Daily Summary | Hourly Summary | Domain Report | Organization Report | Browser Report | Browser Summary | Operating System Report | Status Code Report | File Size Report | File Type Report | Directory Report | Request Report)
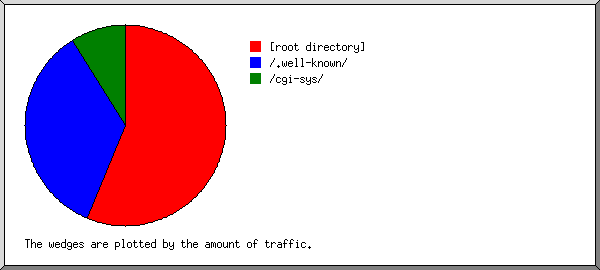
Listing directories with at least 0.01% of the traffic, sorted by the amount of traffic.
| #reqs | %bytes | directory |
|---|---|---|
| 56 | 56.05% | [root directory] |
| 21 | 35.08% | /.well-known/ |
| 27 | 8.87% | /cgi-sys/ |
(Go To: Top | General Summary | Monthly Report | Daily Summary | Hourly Summary | Domain Report | Organization Report | Browser Report | Browser Summary | Operating System Report | Status Code Report | File Size Report | File Type Report | Directory Report | Request Report)

Listing files with at least 20 requests, sorted by the number of requests.
| #reqs | %bytes | last time | file |
|---|---|---|---|
| 33 | 40.34% | May/28/17 1:41 AM | / |
| 27 | 8.87% | Jun/16/17 2:29 PM | /cgi-sys/suspendedpage.cgi |
| 44 | 50.79% | Jun/29/17 6:15 PM | [not listed: 4 files] |