 Web Server Statistics for sirat.solusitotal.com
Program started on Tue, Jun 30 2020 at 7:39 AM.
Analyzed requests from Sun, Dec 11 2016 at 6:01 AM to Tue, Jun 30 2020 at 2:53 AM (1296.87 days).
Web Server Statistics for sirat.solusitotal.comProgram started on Tue, Jun 30 2020 at 7:39 AM.
Analyzed requests from Sun, Dec 11 2016 at 6:01 AM to Tue, Jun 30 2020 at 2:53 AM (1296.87 days).
(Go To: Top | General Summary | Monthly Report | Daily Summary | Hourly Summary | Domain Report | Organization Report | Failed Referrer Report | Browser Report | Browser Summary | Operating System Report | Status Code Report | File Size Report | File Type Report | Directory Report | Request Report)
Figures in parentheses refer to the 7-day period ending Jun 30 2020 at 7:39 AM.
Successful requests: 8,769 (0)
Average successful requests per day: 6
Successful requests for pages: 8,645 (0)
Average successful requests for pages per day: 6
Failed requests: 4,246 (5)
Distinct files requested: 7 (98)
Distinct hosts served: 269 (323)
Data transferred: 94.60 megabytes (0 bytes)
Average data transferred per day: 74.70 kilobytes (0 bytes)
(Go To: Top | General Summary | Monthly Report | Daily Summary | Hourly Summary | Domain Report | Organization Report | Failed Referrer Report | Browser Report | Browser Summary | Operating System Report | Status Code Report | File Size Report | File Type Report | Directory Report | Request Report)
Each unit ( ) represents 15 requests for pages or part thereof.
| month | #reqs | #pages | |
|---|---|---|---|
| Dec 2016 | 444 | 444 |     |
| Jan 2017 | 444 | 444 | |
| Feb 2017 | 333 | 333 | |
| Mar 2017 | 370 | 370 | |
| Apr 2017 | 481 | 481 |  |
| May 2017 | 444 | 444 | |
| Jun 2017 | 111 | 111 | |
| Jul 2017 | 111 | 111 | |
| Aug 2017 | 111 | 111 | |
| Sep 2017 | 111 | 111 | |
| Oct 2017 | 111 | 111 | |
| Nov 2017 | 111 | 111 | |
| Dec 2017 | 222 | 222 | |
| Jan 2018 | 111 | 111 | |
| Feb 2018 | 111 | 111 | |
| Mar 2018 | 111 | 111 | |
| Apr 2018 | 222 | 222 | |
| May 2018 | 111 | 111 | |
| Jun 2018 | 111 | 111 | |
| Jul 2018 | 111 | 111 | |
| Aug 2018 | 111 | 111 | |
| Sep 2018 | 111 | 111 | |
| Oct 2018 | 111 | 111 | |
| Nov 2018 | 111 | 111 | |
| Dec 2018 | 0 | 0 | |
| Jan 2019 | 111 | 111 | |
| Feb 2019 | 111 | 111 | |
| Mar 2019 | 222 | 222 | |
| Apr 2019 | 111 | 111 | |
| May 2019 | 111 | 111 | |
| Jun 2019 | 111 | 111 | |
| Jul 2019 | 222 | 222 | |
| Aug 2019 | 111 | 111 | |
| Sep 2019 | 222 | 222 | |
| Oct 2019 | 222 | 222 | |
| Nov 2019 | 553 | 479 | |
| Dec 2019 | 345 | 313 | |
| Jan 2020 | 342 | 342 | |
| Feb 2020 | 350 | 350 | |
| Mar 2020 | 24 | 24 | |
| Apr 2020 | 480 | 480 | |
| May 2020 | 160 | 142 | |
| Jun 2020 | 225 | 225 | |
Busiest month: Apr 2017 (481 requests for pages).
(Go To: Top | General Summary | Monthly Report | Daily Summary | Hourly Summary | Domain Report | Organization Report | Failed Referrer Report | Browser Report | Browser Summary | Operating System Report | Status Code Report | File Size Report | File Type Report | Directory Report | Request Report)
Each unit () represents 60 requests for pages or part thereof.
| day | #reqs | #pages | |
|---|---|---|---|
| Sun | 1203 | 1203 | |
| Mon | 799 | 799 | |
| Tue | 2701 | 2627 | |
| Wed | 862 | 862 | |
| Thu | 1552 | 1513 | |
| Fri | 269 | 269 | |
| Sat | 1383 | 1372 | |
(Go To: Top | General Summary | Monthly Report | Daily Summary | Hourly Summary | Domain Report | Organization Report | Failed Referrer Report | Browser Report | Browser Summary | Operating System Report | Status Code Report | File Size Report | File Type Report | Directory Report | Request Report)
Each unit () represents 20 requests for pages or part thereof.
| hour | #reqs | #pages | |
|---|---|---|---|
| 0 | 267 | 267 | |
| 1 | 299 | 299 | |
| 2 | 310 | 310 | |
| 3 | 389 | 382 | |
| 4 | 354 | 354 | |
| 5 | 402 | 402 | |
| 6 | 329 | 329 | |
| 7 | 373 | 373 | |
| 8 | 554 | 522 | |
| 9 | 192 | 192 | |
| 10 | 201 | 201 | |
| 11 | 44 | 44 | |
| 12 | 89 | 89 | |
| 13 | 532 | 532 | |
| 14 | 503 | 503 | |
| 15 | 299 | 299 | |
| 16 | 690 | 679 | |
| 17 | 394 | 394 | |
| 18 | 254 | 254 | |
| 19 | 114 | 114 | |
| 20 | 288 | 288 | |
| 21 | 509 | 435 | |
| 22 | 839 | 839 | |
| 23 | 544 | 544 | |
(Go To: Top | General Summary | Monthly Report | Daily Summary | Hourly Summary | Domain Report | Organization Report | Failed Referrer Report | Browser Report | Browser Summary | Operating System Report | Status Code Report | File Size Report | File Type Report | Directory Report | Request Report)
Listing domains, sorted by the amount of traffic.
| #reqs | %bytes | domain |
|---|---|---|
| 8769 | 100% | [unresolved numerical addresses] |
(Go To: Top | General Summary | Monthly Report | Daily Summary | Hourly Summary | Domain Report | Organization Report | Failed Referrer Report | Browser Report | Browser Summary | Operating System Report | Status Code Report | File Size Report | File Type Report | Directory Report | Request Report)

Listing the top 20 organizations by the number of requests, sorted by the number of requests.
| #reqs | %bytes | organization |
|---|---|---|
| 1442 | 12.83% | 138.197 |
| 1171 | 11.09% | 104 |
| 1039 | 9.83% | 45 |
| 838 | 8.78% | 159.203 |
| 595 | 13.70% | 209.17 |
| 527 | 6.09% | 167.71 |
| 407 | 3.62% | 174.138 |
| 299 | 2.66% | 165.227 |
| 259 | 2.30% | 159.65 |
| 258 | 3.33% | 142.93 |
| 222 | 1.98% | 159.89 |
| 221 | 1.97% | 134.209 |
| 208 | 3.80% | 209.97 |
| 207 | 3.04% | 51 |
| 185 | 1.65% | 68.183 |
| 118 | 2.59% | 167.172 |
| 117 | 2.19% | 64.225 |
| 77 | 0.94% | 163.172 |
| 74 | 0.66% | 167.99 |
| 62 | 0.57% | 199.229 |
| 443 | 6.40% | [not listed: 16 organizations] |
(Go To: Top | General Summary | Monthly Report | Daily Summary | Hourly Summary | Domain Report | Organization Report | Failed Referrer Report | Browser Report | Browser Summary | Operating System Report | Status Code Report | File Size Report | File Type Report | Directory Report | Request Report)
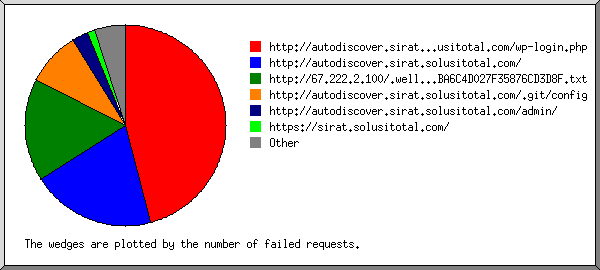
Listing referring URLs, sorted by the number of failed requests.
(Go To: Top | General Summary | Monthly Report | Daily Summary | Hourly Summary | Domain Report | Organization Report | Failed Referrer Report | Browser Report | Browser Summary | Operating System Report | Status Code Report | File Size Report | File Type Report | Directory Report | Request Report)

Listing browsers with at least 1 request for a page, sorted by the number of requests for pages.
| #reqs | #pages | browser |
|---|---|---|
| 4683 | 4683 | Mozilla/5.0 (compatible; NetcraftSurveyAgent/1.0; [email protected]) |
| 2516 | 2516 | Netcraft SSL Server Survey - contact [email protected] |
| 595 | 595 | Mozilla/5.0 (compatible; Nimbostratus-Bot/v1.3.2; http://cloudsystemnetworks.com) |
| 296 | 296 | python-requests/2.20.0 |
| 174 | 174 | Mozilla/5.0 (X11; Linux x86_64) AppleWebKit/537.36 (KHTML, like Gecko) Chrome/78.0.3904.108 Safari/537.36 |
| 97 | 97 | Mozilla/5.0 (X11; Ubuntu; Linux x86_64; rv:58.0) Gecko/20100101 Firefox/58.0 |
| 92 | 92 | Mozilla/5.0 (X11; Ubuntu; Linux x86_64; rv:62.0) Gecko/20100101 Firefox/62.0 |
| 47 | 47 | Mozilla/5.0 (Macintosh; Intel Mac OS X 10.11; rv:47.0) Gecko/20100101 Firefox/47.0 |
| 37 | 37 | Mozilla/5.0 (Windows NT 6.1; WOW64) AppleWebKit/537.36 (KHTML, like Gecko) Chrome/47.0.2526.111 Safari/537.36 |
| 31 | 31 | Mozilla/5.0 |
| 16 | 16 | Mozilla/5.0 (X11; Linux x86_64) AppleWebKit/537.36 (KHTML, like Gecko) Chrome/74.0.3729.169 Safari/537.36 |
| 11 | 11 | Mozilla/5.0 zgrab/0.x |
| 8 | 8 | Mozilla/5.0 (Windows NT 10.0; Win64; x64) AppleWebKit/537.36 (KHTML, like Gecko) Chrome/79.0.3945.79 Safari/537.36 |
| 6 | 6 | Mozilla/5.0 (iPad; CPU OS 10_3_3 like Mac OS X) AppleWebKit/603.3.8 (KHTML, like Gecko) Version/10.0 Mobile/14G60 Safari/602.1 |
| 6 | 6 | Mozilla/5.0 (X11; Linux x86_64) AppleWebKit/537.36 (KHTML, like Gecko) Chrome/51.0.2704.106 Safari/537.36 OPR/38.0.2220.41 |
| 6 | 6 | Mozilla/5.0 (iPhone; CPU iPhone OS 10_2_1 like Mac OS X) AppleWebKit/602.4.6 (KHTML, like Gecko) Version/10.0 Mobile/14D27 Safari/602.1 |
| 6 | 6 | Mozilla/5.0 (Linux; Android 7.0; SM-G925W8 Build/NRD90M) AppleWebKit/537.36 (KHTML, like Gecko) Chrome/61.0.3163.98 Mobile Safari/537.36 |
| 6 | 6 | Mozilla/5.0 (iPad; CPU OS 6_0 like Mac OS X) AppleWebKit/536.26 (KHTML, like Gecko) Version/6.0 Mobile/10A5355d Safari/8536.25 |
| 6 | 6 | Mozilla/5.0 (Windows NT 6.3; Trident/7.0; rv:11.0) like Gecko |
| 6 | 6 | Mozilla/5.0 (Linux; Android 5.1.1; SM-G928X Build/LMY47X) AppleWebKit/537.36 (KHTML, like Gecko) Chrome/47.0.2526.83 Mobile Safari/537.36 |
| 124 | 0 | [not listed: 4 browsers] |
(Go To: Top | General Summary | Monthly Report | Daily Summary | Hourly Summary | Domain Report | Organization Report | Failed Referrer Report | Browser Report | Browser Summary | Operating System Report | Status Code Report | File Size Report | File Type Report | Directory Report | Request Report)

Listing browsers with at least 1 request for a page, sorted by the number of requests for pages.
| # | #reqs | #pages | browser |
|---|---|---|---|
| 1 | 5278 | 5278 | Netscape (compatible) |
| 2 | 2516 | 2516 | Netcraft SSL Server Survey - contact [email protected] |
| 3 | 296 | 296 | python-requests |
| 296 | 296 | python-requests/2 | |
| 4 | 282 | 271 | Safari |
| 264 | 253 | Safari/537 | |
| 12 | 12 | Safari/602 | |
| 6 | 6 | Safari/8536 | |
| 5 | 236 | 236 | Firefox |
| 97 | 97 | Firefox/58 | |
| 92 | 92 | Firefox/62 | |
| 47 | 47 | Firefox/47 | |
| 6 | 48 | 48 | Mozilla |
| 113 | 0 | [not listed: 3 browsers] |
(Go To: Top | General Summary | Monthly Report | Daily Summary | Hourly Summary | Domain Report | Organization Report | Failed Referrer Report | Browser Report | Browser Summary | Operating System Report | Status Code Report | File Size Report | File Type Report | Directory Report | Request Report)

Listing operating systems, sorted by the number of requests for pages.
| # | #reqs | #pages | OS |
|---|---|---|---|
| 1 | 8213 | 8132 | OS unknown |
| 2 | 397 | 397 | Unix |
| 397 | 397 | Linux | |
| 3 | 65 | 65 | Macintosh |
| 4 | 94 | 51 | Windows |
| 43 | 43 | Unknown Windows | |
| 19 | 8 | Windows NT | |
| 32 | 0 | Windows 2000 |
(Go To: Top | General Summary | Monthly Report | Daily Summary | Hourly Summary | Domain Report | Organization Report | Failed Referrer Report | Browser Report | Browser Summary | Operating System Report | Status Code Report | File Size Report | File Type Report | Directory Report | Request Report)

Listing status codes, sorted numerically.
| #reqs | status code |
|---|---|
| 8769 | 200 OK |
| 1235 | 400 Bad request |
| 2250 | 404 Document not found |
| 761 | 503 Service temporarily unavailable |
(Go To: Top | General Summary | Monthly Report | Daily Summary | Hourly Summary | Domain Report | Organization Report | Failed Referrer Report | Browser Report | Browser Summary | Operating System Report | Status Code Report | File Size Report | File Type Report | Directory Report | Request Report)
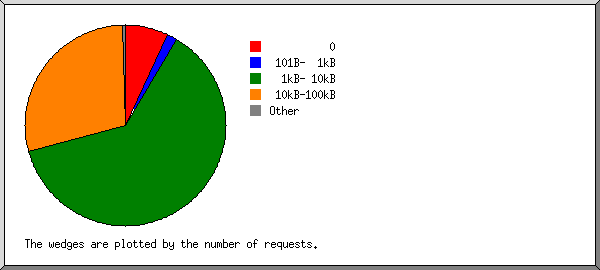
| size | #reqs | %bytes |
|---|---|---|
| 0 | 0 | |
| 1B- 10B | 0 | |
| 11B- 100B | 0 | |
| 101B- 1kB | 0 | |
| 1kB- 10kB | 7644 | 68.04% |
| 10kB-100kB | 1125 | 31.96% |
(Go To: Top | General Summary | Monthly Report | Daily Summary | Hourly Summary | Domain Report | Organization Report | Failed Referrer Report | Browser Report | Browser Summary | Operating System Report | Status Code Report | File Size Report | File Type Report | Directory Report | Request Report)

Listing extensions with at least 0.1% of the traffic, sorted by the amount of traffic.
| #reqs | %bytes | extension |
|---|---|---|
| 8645 | 98.25% | [directories] |
| 106 | 1.25% | [no extension] |
| 18 | 0.50% | .php [PHP] |
(Go To: Top | General Summary | Monthly Report | Daily Summary | Hourly Summary | Domain Report | Organization Report | Failed Referrer Report | Browser Report | Browser Summary | Operating System Report | Status Code Report | File Size Report | File Type Report | Directory Report | Request Report)

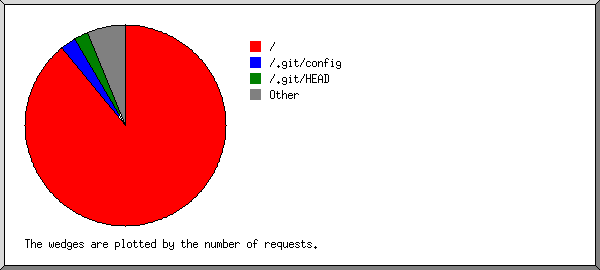
Listing directories with at least 0.01% of the traffic, sorted by the amount of traffic.
| #reqs | %bytes | directory |
|---|---|---|
| 8616 | 98.07% | [root directory] |
| 74 | 0.87% | /.git/ |
| 18 | 0.50% | /adminer/ |
| 31 | 0.29% | /admin/ |
| 30 | 0.27% | /index.php/ |
(Go To: Top | General Summary | Monthly Report | Daily Summary | Hourly Summary | Domain Report | Organization Report | Failed Referrer Report | Browser Report | Browser Summary | Operating System Report | Status Code Report | File Size Report | File Type Report | Directory Report | Request Report)
Listing files with at least 20 requests, sorted by the number of requests.
| #reqs | %bytes | last time | file |
|---|---|---|---|
| 8584 | 97.69% | Jun/22/20 2:59 PM | / |
| 37 | 0.33% | Jan/31/20 11:08 AM | /?104.236.19.32 |
| 74 | 0.87% | Nov/12/19 9:57 PM | /.git/config |
| 32 | 0.38% | Dec/12/19 8:54 AM | /dasdasd |
| 31 | 0.29% | Dec/15/19 6:39 PM | /admin/ |
| 30 | 0.27% | Dec/18/19 9:21 PM | /index.php/admin/ |
| 18 | 0.50% | May/21/20 3:05 AM | [not listed: 1 file] |