 Web Server Statistics for aquit.sogoodthatis.com
Program started on Tue, Dec 31 2019 at 3:32 PM.
Analyzed requests from Mon, Nov 11 2019 at 9:45 PM to Tue, Dec 31 2019 at 3:17 PM (49.73 days).
Web Server Statistics for aquit.sogoodthatis.comProgram started on Tue, Dec 31 2019 at 3:32 PM.
Analyzed requests from Mon, Nov 11 2019 at 9:45 PM to Tue, Dec 31 2019 at 3:17 PM (49.73 days).
(Go To: Top | General Summary | Monthly Report | Daily Summary | Hourly Summary | Domain Report | Organization Report | Failed Referrer Report | Browser Report | Browser Summary | Operating System Report | Status Code Report | File Size Report | File Type Report | Directory Report | Request Report)
Figures in parentheses refer to the 7-day period ending Dec 31 2019 at 3:32 PM.
Successful requests: 1,445 (20)
Average successful requests per day: 29 (2)
Successful requests for pages: 1,019 (20)
Average successful requests for pages per day: 20 (2)
Failed requests: 3,289 (0)
Redirected requests: 8,795 (5)
Distinct files requested: 16 (419)
Distinct hosts served: 11 (68)
Data transferred: 45.76 megabytes (228.54 kilobytes)
Average data transferred per day: 942.34 kilobytes (32.65 kilobytes)
(Go To: Top | General Summary | Monthly Report | Daily Summary | Hourly Summary | Domain Report | Organization Report | Failed Referrer Report | Browser Report | Browser Summary | Operating System Report | Status Code Report | File Size Report | File Type Report | Directory Report | Request Report)
Each unit ( ) represents 25 requests for pages or part thereof.
| month | #reqs | #pages | |
|---|---|---|---|
| Nov 2019 | 90 | 88 |  |
| Dec 2019 | 1355 | 931 |   |
Busiest month: Dec 2019 (931 requests for pages).
(Go To: Top | General Summary | Monthly Report | Daily Summary | Hourly Summary | Domain Report | Organization Report | Failed Referrer Report | Browser Report | Browser Summary | Operating System Report | Status Code Report | File Size Report | File Type Report | Directory Report | Request Report)
Each unit () represents 15 requests for pages or part thereof.
| day | #reqs | #pages | |
|---|---|---|---|
| Sun | 0 | 0 | |
| Mon | 640 | 406 |   |
| Tue | 24 | 24 | |
| Wed | 62 | 62 | |
| Thu | 717 | 527 | |
| Fri | 2 | 0 | |
| Sat | 0 | 0 |
(Go To: Top | General Summary | Monthly Report | Daily Summary | Hourly Summary | Domain Report | Organization Report | Failed Referrer Report | Browser Report | Browser Summary | Operating System Report | Status Code Report | File Size Report | File Type Report | Directory Report | Request Report)
Each unit () represents 10 requests for pages or part thereof.
| hour | #reqs | #pages | |
|---|---|---|---|
| 0 | 0 | 0 | |
| 1 | 44 | 44 | |
| 2 | 0 | 0 | |
| 3 | 42 | 42 | |
| 4 | 0 | 0 | |
| 5 | 0 | 0 | |
| 6 | 0 | 0 | |
| 7 | 624 | 380 | |
| 8 | 0 | 0 | |
| 9 | 0 | 0 | |
| 10 | 0 | 0 | |
| 11 | 0 | 0 | |
| 12 | 540 | 360 | |
| 13 | 0 | 0 | |
| 14 | 0 | 0 | |
| 15 | 0 | 0 | |
| 16 | 49 | 49 | |
| 17 | 98 | 98 | |
| 18 | 0 | 0 | |
| 19 | 0 | 0 | |
| 20 | 0 | 0 | |
| 21 | 46 | 46 | |
| 22 | 2 | 0 | |
| 23 | 0 | 0 |
(Go To: Top | General Summary | Monthly Report | Daily Summary | Hourly Summary | Domain Report | Organization Report | Failed Referrer Report | Browser Report | Browser Summary | Operating System Report | Status Code Report | File Size Report | File Type Report | Directory Report | Request Report)
Listing domains, sorted by the amount of traffic.
| #reqs | %bytes | domain |
|---|---|---|
| 1445 | 100% | [unresolved numerical addresses] |
(Go To: Top | General Summary | Monthly Report | Daily Summary | Hourly Summary | Domain Report | Organization Report | Failed Referrer Report | Browser Report | Browser Summary | Operating System Report | Status Code Report | File Size Report | File Type Report | Directory Report | Request Report)

Listing organizations, sorted by the number of requests.
| #reqs | %bytes | organization |
|---|---|---|
| 570 | 43.38% | 173.244 |
| 540 | 41.12% | 194.187 |
| 98 | 3.79% | 167.172 |
| 54 | 4.11% | 5 |
| 49 | 3.73% | 159.203 |
| 46 | 185.220 | |
| 44 | 0.52% | 163.172 |
| 42 | 3.20% | 62.4 |
| 2 | 0.15% | 178.128 |
(Go To: Top | General Summary | Monthly Report | Daily Summary | Hourly Summary | Domain Report | Organization Report | Failed Referrer Report | Browser Report | Browser Summary | Operating System Report | Status Code Report | File Size Report | File Type Report | Directory Report | Request Report)

Listing referring URLs, sorted by the number of failed requests.
| #reqs | URL |
|---|---|
| 88 | http://autodiscover.aquit.fr/wp-login.php |
| 46 | http://autodiscover.aquit.fr/.git/config |
(Go To: Top | General Summary | Monthly Report | Daily Summary | Hourly Summary | Domain Report | Organization Report | Failed Referrer Report | Browser Report | Browser Summary | Operating System Report | Status Code Report | File Size Report | File Type Report | Directory Report | Request Report)

Listing browsers with at least 1 request for a page, sorted by the number of requests for pages.
| #reqs | #pages | browser |
|---|---|---|
| 1110 | 740 | Mozilla/5.0 (X11; Ubuntu; Linux x86_64; rv:62.0) Gecko/20100101 Firefox/62.0 |
| 147 | 147 | Mozilla/5.0 (compatible; NetcraftSurveyAgent/1.0; [email protected]) |
| 46 | 46 | python-requests/2.21.0 |
| 44 | 44 | Mozilla/5.0 (X11; Linux x86_64) AppleWebKit/537.36 (KHTML, like Gecko) Chrome/78.0.3904.108 Safari/537.36 |
| 42 | 42 | Mozilla/5.0 (X11; Ubuntu; Linux x86_64; rv:58.0) Gecko/20100101 Firefox/58.0 |
| 56 | 0 | [not listed: 1 browser] |
(Go To: Top | General Summary | Monthly Report | Daily Summary | Hourly Summary | Domain Report | Organization Report | Failed Referrer Report | Browser Report | Browser Summary | Operating System Report | Status Code Report | File Size Report | File Type Report | Directory Report | Request Report)

Listing browsers with at least 1 request for a page, sorted by the number of requests for pages.
| # | #reqs | #pages | browser |
|---|---|---|---|
| 1 | 1152 | 782 | Firefox |
| 1110 | 740 | Firefox/62 | |
| 42 | 42 | Firefox/58 | |
| 2 | 147 | 147 | Netscape (compatible) |
| 3 | 46 | 46 | python-requests |
| 46 | 46 | python-requests/2 | |
| 4 | 44 | 44 | Safari |
| 44 | 44 | Safari/537 | |
| 56 | 0 | [not listed: 1 browser] |
(Go To: Top | General Summary | Monthly Report | Daily Summary | Hourly Summary | Domain Report | Organization Report | Failed Referrer Report | Browser Report | Browser Summary | Operating System Report | Status Code Report | File Size Report | File Type Report | Directory Report | Request Report)

Listing operating systems, sorted by the number of requests for pages.
| # | #reqs | #pages | OS |
|---|---|---|---|
| 1 | 1196 | 826 | Unix |
| 1196 | 826 | Linux | |
| 2 | 249 | 193 | OS unknown |
(Go To: Top | General Summary | Monthly Report | Daily Summary | Hourly Summary | Domain Report | Organization Report | Failed Referrer Report | Browser Report | Browser Summary | Operating System Report | Status Code Report | File Size Report | File Type Report | Directory Report | Request Report)
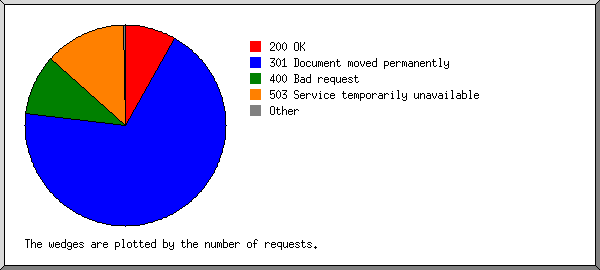
Listing status codes, sorted numerically.
| #reqs | status code |
|---|---|
| 1445 | 200 OK |
| 8795 | 301 Document moved permanently |
| 2561 | 400 Bad request |
| 20 | 404 Document not found |
| 708 | 503 Service temporarily unavailable |
(Go To: Top | General Summary | Monthly Report | Daily Summary | Hourly Summary | Domain Report | Organization Report | Failed Referrer Report | Browser Report | Browser Summary | Operating System Report | Status Code Report | File Size Report | File Type Report | Directory Report | Request Report)

| size | #reqs | %bytes |
|---|---|---|
| 0 | 46 | |
| 1B- 10B | 0 | |
| 11B- 100B | 0 | |
| 101B- 1kB | 73 | 0.09% |
| 1kB- 10kB | 0 | |
| 10kB-100kB | 1326 | 99.91% |
(Go To: Top | General Summary | Monthly Report | Daily Summary | Hourly Summary | Domain Report | Organization Report | Failed Referrer Report | Browser Report | Browser Summary | Operating System Report | Status Code Report | File Size Report | File Type Report | Directory Report | Request Report)

Listing extensions with at least 0.1% of the traffic, sorted by the amount of traffic.
| #reqs | %bytes | extension |
|---|---|---|
| 1019 | 67.56% | [directories] |
| 426 | 32.44% | .php [PHP] |
(Go To: Top | General Summary | Monthly Report | Daily Summary | Hourly Summary | Domain Report | Organization Report | Failed Referrer Report | Browser Report | Browser Summary | Operating System Report | Status Code Report | File Size Report | File Type Report | Directory Report | Request Report)
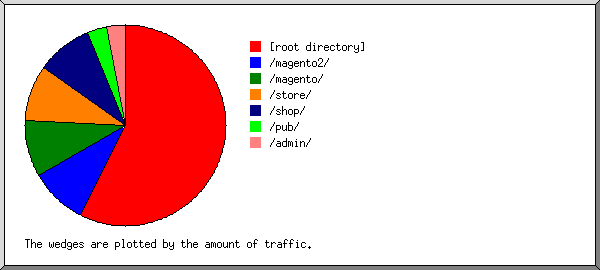
Listing directories with at least 0.01% of the traffic, sorted by the amount of traffic.
| #reqs | %bytes | directory |
|---|---|---|
| 409 | 21.13% | [root directory] |
| 222 | 16.90% | /magento2/ |
| 222 | 16.90% | /magento/ |
| 222 | 16.90% | /store/ |
| 222 | 16.90% | /shop/ |
| 74 | 5.63% | /pub/ |
| 74 | 5.63% | /admin/ |
(Go To: Top | General Summary | Monthly Report | Daily Summary | Hourly Summary | Domain Report | Organization Report | Failed Referrer Report | Browser Report | Browser Summary | Operating System Report | Status Code Report | File Size Report | File Type Report | Directory Report | Request Report)

Listing files with at least 20 requests, sorted by the number of requests.
| #reqs | %bytes | last time | file |
|---|---|---|---|
| 353 | 16.87% | Dec/25/19 1:42 AM | / |
| 74 | 5.63% | Dec/16/19 12:37 PM | /store/admin/ |
| 74 | 5.63% | Dec/16/19 12:37 PM | /store/ |
| 74 | 5.64% | Dec/16/19 12:37 PM | /magento/pub/errors/503.php |
| 74 | 5.63% | Dec/16/19 12:37 PM | /shop/pub/errors/503.php |
| 74 | 5.64% | Dec/16/19 12:37 PM | /magento2/pub/errors/503.php |
| 74 | 5.63% | Dec/16/19 12:37 PM | /pub/errors/503.php |
| 74 | 5.63% | Dec/16/19 12:37 PM | /magento2/admin/ |
| 74 | 5.63% | Dec/16/19 12:37 PM | /magento2/ |
| 74 | 5.63% | Dec/16/19 12:37 PM | /admin/ |
| 74 | 5.63% | Dec/16/19 12:37 PM | /magento/ |
| 74 | 5.63% | Dec/16/19 12:37 PM | /shop/admin/ |
| 74 | 5.63% | Dec/16/19 12:37 PM | /shop/ |
| 74 | 5.63% | Dec/16/19 12:37 PM | /magento/admin/ |
| 74 | 5.63% | Dec/16/19 12:37 PM | /store/pub/errors/503.php |
| 56 | 4.26% | Dec/ 2/19 7:00 AM | /wp-login.php |