 Web Server Statistics for tekad.solusitotal.com
Program started on Thu, Nov 05 2020 at 3:36 PM.
Analyzed requests from Sun, Nov 01 2020 at 7:46 PM to Thu, Nov 05 2020 at 2:32 PM (3.78 days).
Web Server Statistics for tekad.solusitotal.comProgram started on Thu, Nov 05 2020 at 3:36 PM.
Analyzed requests from Sun, Nov 01 2020 at 7:46 PM to Thu, Nov 05 2020 at 2:32 PM (3.78 days).
(Go To: Top | General Summary | Monthly Report | Daily Summary | Hourly Summary | Domain Report | Organization Report | Browser Report | Browser Summary | Operating System Report | Status Code Report | File Size Report | File Type Report | Directory Report | Request Report)
Successful requests: 100
Average successful requests per day: 26
Successful requests for pages: 82
Average successful requests for pages per day: 21
Failed requests: 208
Distinct files requested: 2
Distinct hosts served: 5
Data transferred: 0.98 megabytes
Average data transferred per day: 266.33 kilobytes
(Go To: Top | General Summary | Monthly Report | Daily Summary | Hourly Summary | Domain Report | Organization Report | Browser Report | Browser Summary | Operating System Report | Status Code Report | File Size Report | File Type Report | Directory Report | Request Report)
Each unit ( ) represents 3 requests for pages or part thereof.
| month | #reqs | #pages | |
|---|---|---|---|
| Nov 2020 | 100 | 82 |    |
Busiest month: Nov 2020 (82 requests for pages).
(Go To: Top | General Summary | Monthly Report | Daily Summary | Hourly Summary | Domain Report | Organization Report | Browser Report | Browser Summary | Operating System Report | Status Code Report | File Size Report | File Type Report | Directory Report | Request Report)
Each unit () represents 2 requests for pages or part thereof.
| day | #reqs | #pages | |
|---|---|---|---|
| Sun | 0 | 0 | |
| Mon | 72 | 72 |  |
| Tue | 25 | 7 | |
| Wed | 3 | 3 |  |
| Thu | 0 | 0 | |
| Fri | 0 | 0 | |
| Sat | 0 | 0 |
(Go To: Top | General Summary | Monthly Report | Daily Summary | Hourly Summary | Domain Report | Organization Report | Browser Report | Browser Summary | Operating System Report | Status Code Report | File Size Report | File Type Report | Directory Report | Request Report)
Each unit () represents 2 requests for pages or part thereof.
| hour | #reqs | #pages | |
|---|---|---|---|
| 0 | 9 | 0 | |
| 1 | 9 | 0 | |
| 2 | 0 | 0 | |
| 3 | 0 | 0 | |
| 4 | 0 | 0 | |
| 5 | 0 | 0 | |
| 6 | 0 | 0 | |
| 7 | 0 | 0 | |
| 8 | 7 | 7 | |
| 9 | 0 | 0 | |
| 10 | 0 | 0 | |
| 11 | 0 | 0 | |
| 12 | 22 | 22 | |
| 13 | 0 | 0 | |
| 14 | 0 | 0 | |
| 15 | 3 | 3 | |
| 16 | 0 | 0 | |
| 17 | 50 | 50 | |
| 18 | 0 | 0 | |
| 19 | 0 | 0 | |
| 20 | 0 | 0 | |
| 21 | 0 | 0 | |
| 22 | 0 | 0 | |
| 23 | 0 | 0 |
(Go To: Top | General Summary | Monthly Report | Daily Summary | Hourly Summary | Domain Report | Organization Report | Browser Report | Browser Summary | Operating System Report | Status Code Report | File Size Report | File Type Report | Directory Report | Request Report)
Listing domains, sorted by the amount of traffic.
| #reqs | %bytes | domain |
|---|---|---|
| 100 | 100% | [unresolved numerical addresses] |
(Go To: Top | General Summary | Monthly Report | Daily Summary | Hourly Summary | Domain Report | Organization Report | Browser Report | Browser Summary | Operating System Report | Status Code Report | File Size Report | File Type Report | Directory Report | Request Report)
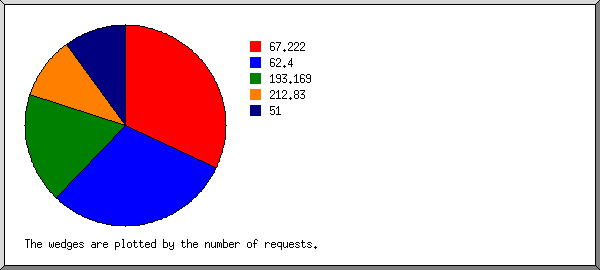
Listing organizations, sorted by the number of requests.
| #reqs | %bytes | organization |
|---|---|---|
| 32 | 2.49% | 67.222 |
| 30 | 2.33% | 62.4 |
| 18 | 21.67% | 193.169 |
| 10 | 36.77% | 212.83 |
| 10 | 36.75% | 51 |
(Go To: Top | General Summary | Monthly Report | Daily Summary | Hourly Summary | Domain Report | Organization Report | Browser Report | Browser Summary | Operating System Report | Status Code Report | File Size Report | File Type Report | Directory Report | Request Report)
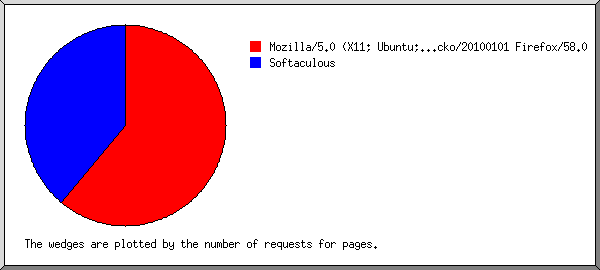
Listing browsers with at least 1 request for a page, sorted by the number of requests for pages.
| #reqs | #pages | browser |
|---|---|---|
| 50 | 50 | Mozilla/5.0 (X11; Ubuntu; Linux x86_64; rv:58.0) Gecko/20100101 Firefox/58.0 |
| 32 | 32 | Softaculous |
| 18 | 0 | [not listed: 1 browser] |
(Go To: Top | General Summary | Monthly Report | Daily Summary | Hourly Summary | Domain Report | Organization Report | Browser Report | Browser Summary | Operating System Report | Status Code Report | File Size Report | File Type Report | Directory Report | Request Report)
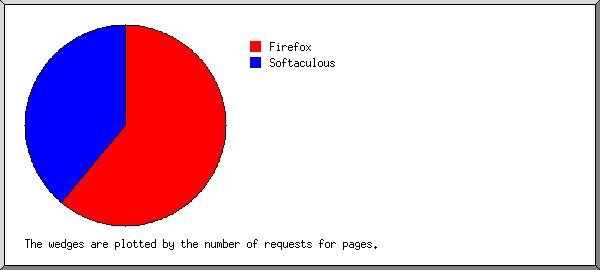
Listing browsers with at least 1 request for a page, sorted by the number of requests for pages.
| # | #reqs | #pages | browser |
|---|---|---|---|
| 1 | 68 | 50 | Firefox |
| 50 | 50 | Firefox/58 | |
| 2 | 32 | 32 | Softaculous |
(Go To: Top | General Summary | Monthly Report | Daily Summary | Hourly Summary | Domain Report | Organization Report | Browser Report | Browser Summary | Operating System Report | Status Code Report | File Size Report | File Type Report | Directory Report | Request Report)

Listing operating systems, sorted by the number of requests for pages.
| # | #reqs | #pages | OS |
|---|---|---|---|
| 1 | 50 | 50 | Unix |
| 50 | 50 | Linux | |
| 2 | 32 | 32 | OS unknown |
| 3 | 18 | 0 | Windows |
| 18 | 0 | Windows NT |
(Go To: Top | General Summary | Monthly Report | Daily Summary | Hourly Summary | Domain Report | Organization Report | Browser Report | Browser Summary | Operating System Report | Status Code Report | File Size Report | File Type Report | Directory Report | Request Report)
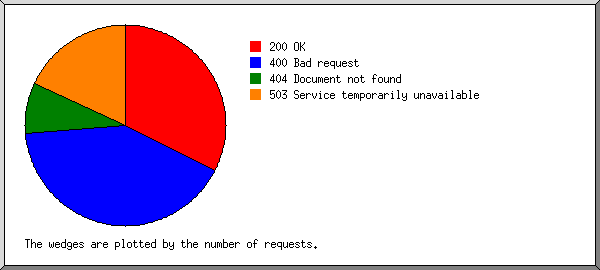
Listing status codes, sorted numerically.
| #reqs | status code |
|---|---|
| 100 | 200 OK |
| 127 | 400 Bad request |
| 25 | 404 Document not found |
| 56 | 503 Service temporarily unavailable |
(Go To: Top | General Summary | Monthly Report | Daily Summary | Hourly Summary | Domain Report | Organization Report | Browser Report | Browser Summary | Operating System Report | Status Code Report | File Size Report | File Type Report | Directory Report | Request Report)
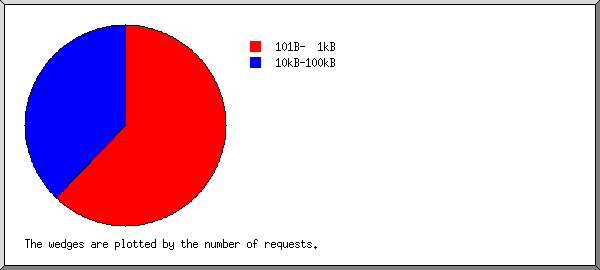
| size | #reqs | %bytes |
|---|---|---|
| 0 | 0 | |
| 1B- 10B | 0 | |
| 11B- 100B | 0 | |
| 101B- 1kB | 62 | 4.81% |
| 1kB- 10kB | 0 | |
| 10kB-100kB | 38 | 95.19% |
(Go To: Top | General Summary | Monthly Report | Daily Summary | Hourly Summary | Domain Report | Organization Report | Browser Report | Browser Summary | Operating System Report | Status Code Report | File Size Report | File Type Report | Directory Report | Request Report)
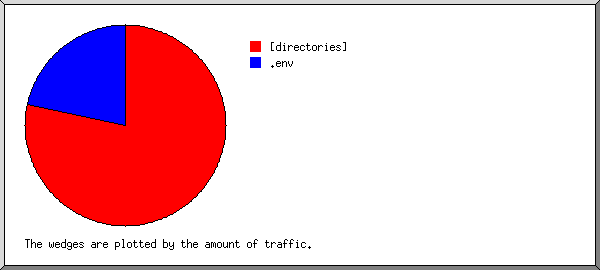
Listing extensions with at least 0.1% of the traffic, sorted by the amount of traffic.
| #reqs | %bytes | extension |
|---|---|---|
| 82 | 78.33% | [directories] |
| 18 | 21.67% | .env |
(Go To: Top | General Summary | Monthly Report | Daily Summary | Hourly Summary | Domain Report | Organization Report | Browser Report | Browser Summary | Operating System Report | Status Code Report | File Size Report | File Type Report | Directory Report | Request Report)
Listing directories with at least 0.01% of the traffic, sorted by the amount of traffic.
| #reqs | %bytes | directory |
|---|---|---|
| 100 | 100% | [root directory] |
(Go To: Top | General Summary | Monthly Report | Daily Summary | Hourly Summary | Domain Report | Organization Report | Browser Report | Browser Summary | Operating System Report | Status Code Report | File Size Report | File Type Report | Directory Report | Request Report)

Listing files with at least 20 requests, sorted by the number of requests.
| #reqs | %bytes | last time | file |
|---|---|---|---|
| 82 | 78.33% | Nov/ 4/20 3:43 PM | / |
| 18 | 21.67% | Nov/ 3/20 1:59 AM | [not listed: 1 file] |