Web Server Statistics for nirwanabroadcast.vin-fm.comProgram started on Mon, Sep 24 2012 at 7:32 PM.
Analyzed requests from Sat, Sep 01 2012 at 5:04 AM to Mon, Sep 24 2012 at 6:17 AM (23.05 days).
(Go To: Top | General Summary | Monthly Report | Daily Summary | Hourly Summary | Domain Report | Organization Report | Redirected Referrer Report | Failed Referrer Report | Referring Site Report | Browser Report | Browser Summary | Operating System Report | Status Code Report | File Size Report | File Type Report | Directory Report | Request Report)
Figures in parentheses refer to the 7-day period ending Sep 24 2012 at 7:32 PM.
Successful requests: 1,479 (46)
Average successful requests per day: 64 (6)
Successful requests for pages: 47 (2)
Average successful requests for pages per day: 1 (0)
Failed requests: 23 (0)
Redirected requests: 16 (0)
Distinct files requested: 256 (34)
Distinct hosts served: 23 (2)
Data transferred: 10.92 megabytes (532.19 kilobytes)
Average data transferred per day: 485.15 kilobytes (76.03 kilobytes)
(Go To: Top | General Summary | Monthly Report | Daily Summary | Hourly Summary | Domain Report | Organization Report | Redirected Referrer Report | Failed Referrer Report | Referring Site Report | Browser Report | Browser Summary | Operating System Report | Status Code Report | File Size Report | File Type Report | Directory Report | Request Report)
Each unit (
) represents 2 requests for pages or part thereof.
| month | #reqs | #pages | |
|---|---|---|---|
| Sep 2012 | 1479 | 47 | ![]() ![]() |
Busiest month: Sep 2012 (47 requests for pages).
(Go To: Top | General Summary | Monthly Report | Daily Summary | Hourly Summary | Domain Report | Organization Report | Redirected Referrer Report | Failed Referrer Report | Referring Site Report | Browser Report | Browser Summary | Operating System Report | Status Code Report | File Size Report | File Type Report | Directory Report | Request Report)
Each unit (
) represents 1 request for a page.
| day | #reqs | #pages | |
|---|---|---|---|
| Sun | 217 | 9 | ![]() ![]() |
| Mon | 64 | 3 | ![]() ![]() |
| Tue | 41 | 3 | ![]() ![]() |
| Wed | 72 | 2 | ![]() |
| Thu | 60 | 2 | ![]() |
| Fri | 33 | 1 | ![]() |
| Sat | 992 | 27 | ![]() ![]() ![]() ![]() |
(Go To: Top | General Summary | Monthly Report | Daily Summary | Hourly Summary | Domain Report | Organization Report | Redirected Referrer Report | Failed Referrer Report | Referring Site Report | Browser Report | Browser Summary | Operating System Report | Status Code Report | File Size Report | File Type Report | Directory Report | Request Report)
Each unit (
) represents 1 request for a page.
| hour | #reqs | #pages | |
|---|---|---|---|
| 0 | 0 | 0 | |
| 1 | 0 | 0 | |
| 2 | 0 | 0 | |
| 3 | 0 | 0 | |
| 4 | 0 | 0 | |
| 5 | 37 | 2 | ![]() |
| 6 | 1 | 0 | |
| 7 | 33 | 1 | ![]() |
| 8 | 26 | 1 | ![]() |
| 9 | 0 | 0 | |
| 10 | 0 | 0 | |
| 11 | 32 | 1 | ![]() |
| 12 | 28 | 1 | ![]() |
| 13 | 33 | 1 | ![]() |
| 14 | 30 | 2 | ![]() |
| 15 | 191 | 5 | ![]() ![]() |
| 16 | 90 | 0 | |
| 17 | 0 | 0 | |
| 18 | 4 | 1 | ![]() |
| 19 | 707 | 21 | ![]() ![]() ![]() |
| 20 | 73 | 3 | ![]() ![]() |
| 21 | 10 | 2 | ![]() |
| 22 | 105 | 3 | ![]() ![]() |
| 23 | 79 | 3 | ![]() ![]() |
(Go To: Top | General Summary | Monthly Report | Daily Summary | Hourly Summary | Domain Report | Organization Report | Redirected Referrer Report | Failed Referrer Report | Referring Site Report | Browser Report | Browser Summary | Operating System Report | Status Code Report | File Size Report | File Type Report | Directory Report | Request Report)
Listing domains, sorted by the amount of traffic.
| #reqs | %bytes | domain |
|---|---|---|
| 1479 | 100% | [unresolved numerical addresses] |
(Go To: Top | General Summary | Monthly Report | Daily Summary | Hourly Summary | Domain Report | Organization Report | Redirected Referrer Report | Failed Referrer Report | Referring Site Report | Browser Report | Browser Summary | Operating System Report | Status Code Report | File Size Report | File Type Report | Directory Report | Request Report)

Listing organizations, sorted by the number of requests.
| #reqs | %bytes | organization |
|---|---|---|
| 696 | 10.49% | 112 |
| 322 | 26.71% | 110 |
| 316 | 43.56% | 114 |
| 45 | 4.74% | 36 |
| 40 | 4.62% | 180.246 |
| 33 | 5.54% | 180.251 |
| 26 | 4.31% | 180.248 |
| 1 | 0.02% | 69 |
(Go To: Top | General Summary | Monthly Report | Daily Summary | Hourly Summary | Domain Report | Organization Report | Redirected Referrer Report | Failed Referrer Report | Referring Site Report | Browser Report | Browser Summary | Operating System Report | Status Code Report | File Size Report | File Type Report | Directory Report | Request Report)

Listing referring URLs, sorted by the number of redirected requests.
| #reqs | URL |
|---|---|
| 9 | http://www.nirwanabroadcast.co.cc/admin/index.php |
| 6 | http://www.nirwanabroadcast.co.cc/admin/ |
(Go To: Top | General Summary | Monthly Report | Daily Summary | Hourly Summary | Domain Report | Organization Report | Redirected Referrer Report | Failed Referrer Report | Referring Site Report | Browser Report | Browser Summary | Operating System Report | Status Code Report | File Size Report | File Type Report | Directory Report | Request Report)

Listing referring URLs, sorted by the number of failed requests.
| #reqs | URL |
|---|---|
| 6 | http://www.nirwanabroadcast.co.cc/ |
| 5 | http://s.nsdsvc.com/App/DddWrapper.swf |
| 2 | http://www.nirwanabroadcast.co.cc/admin/index.php |
| 1 | http://www.nirwanabroadcast.co.cc/admin/ |
(Go To: Top | General Summary | Monthly Report | Daily Summary | Hourly Summary | Domain Report | Organization Report | Redirected Referrer Report | Failed Referrer Report | Referring Site Report | Browser Report | Browser Summary | Operating System Report | Status Code Report | File Size Report | File Type Report | Directory Report | Request Report)

Listing referring sites, sorted by the number of requests.
| #reqs | site |
|---|---|
| 1412 | http://www.nirwanabroadcast.co.cc/ |
| 9 | http://www.facebook.com/ |
(Go To: Top | General Summary | Monthly Report | Daily Summary | Hourly Summary | Domain Report | Organization Report | Redirected Referrer Report | Failed Referrer Report | Referring Site Report | Browser Report | Browser Summary | Operating System Report | Status Code Report | File Size Report | File Type Report | Directory Report | Request Report)

Listing browsers with at least 1 request for a page, sorted by the number of requests for pages.
| #reqs | #pages | browser |
|---|---|---|
| 670 | 21 | Mozilla/5.0 (Windows NT 5.1; rv:15.0) Gecko/20100101 Firefox/15.0 |
| 216 | 9 | Mozilla/5.0 (Windows NT 6.1; rv:13.0) Gecko/20100101 Firefox/13.0.1 |
| 285 | 6 | Mozilla/5.0 (Windows NT 5.1; rv:12.0) Gecko/20100101 Firefox/12.0 |
| 37 | 2 | Mozilla/5.0 (Windows NT 5.1; rv:11.0) Gecko/20100101 Firefox/11.0 |
| 59 | 2 | Mozilla/5.0 (Windows NT 5.1; rv:15.0) Gecko/20100101 Firefox/15.0.1 |
| 45 | 1 | Mozilla/5.0 (Windows NT 6.0) AppleWebKit/537.1 (KHTML, like Gecko) Chrome/21.0.1180.89 Safari/537.1 |
| 26 | 1 | Mozilla/5.0 (Windows NT 5.1; rv:14.0) Gecko/20100101 Firefox/14.0.1 |
| 40 | 1 | Opera/9.80 (Windows NT 5.1; U; id) Presto/2.7.62 Version/11.01 |
| 1 | 1 | facebookexternalhit/1.1 (+http://www.facebook.com/externalhit_uatext.php) |
| 34 | 1 | Mozilla/5.0 (Windows NT 6.1; rv:11.0) Gecko/20100101 Firefox/11.0 |
| 33 | 1 | Mozilla/5.0 (Windows; U; Windows NT 5.1; en-US; rv:1.9.0.7) Gecko/2009021910 Firefox/3.0.7 |
| 33 | 1 | Mozilla/5.0 (Windows NT 6.1) AppleWebKit/537.1 (KHTML, like Gecko) Chrome/21.0.1180.83 Safari/537.1 |
(Go To: Top | General Summary | Monthly Report | Daily Summary | Hourly Summary | Domain Report | Organization Report | Redirected Referrer Report | Failed Referrer Report | Referring Site Report | Browser Report | Browser Summary | Operating System Report | Status Code Report | File Size Report | File Type Report | Directory Report | Request Report)

Listing browsers with at least 1 request for a page, sorted by the number of requests for pages.
| # | #reqs | #pages | browser |
|---|---|---|---|
| 1 | 1360 | 43 | Firefox |
| 729 | 23 | Firefox/15 | |
| 216 | 9 | Firefox/13 | |
| 285 | 6 | Firefox/12 | |
| 71 | 3 | Firefox/11 | |
| 26 | 1 | Firefox/14 | |
| 33 | 1 | Firefox/3 | |
| 2 | 78 | 2 | Safari |
| 78 | 2 | Safari/537 | |
| 3 | 1 | 1 | facebookexternalhit |
| 1 | 1 | facebookexternalhit/1 | |
| 4 | 40 | 1 | Opera |
| 40 | 1 | Opera/9 |
(Go To: Top | General Summary | Monthly Report | Daily Summary | Hourly Summary | Domain Report | Organization Report | Redirected Referrer Report | Failed Referrer Report | Referring Site Report | Browser Report | Browser Summary | Operating System Report | Status Code Report | File Size Report | File Type Report | Directory Report | Request Report)

Listing operating systems, sorted by the number of requests for pages.
| # | #reqs | #pages | OS |
|---|---|---|---|
| 1 | 1478 | 46 | Windows |
| 1150 | 34 | Windows XP | |
| 328 | 12 | Unknown Windows | |
| 2 | 1 | 1 | OS unknown |
(Go To: Top | General Summary | Monthly Report | Daily Summary | Hourly Summary | Domain Report | Organization Report | Redirected Referrer Report | Failed Referrer Report | Referring Site Report | Browser Report | Browser Summary | Operating System Report | Status Code Report | File Size Report | File Type Report | Directory Report | Request Report)

Listing status codes, sorted numerically.
| #reqs | status code |
|---|---|
| 1275 | 200 OK |
| 2 | 206 Partial content |
| 1 | 301 Document moved permanently |
| 15 | 302 Document found elsewhere |
| 202 | 304 Not modified since last retrieval |
| 1 | 400 Bad request |
| 21 | 404 Document not found |
| 1 | 4xx [Miscellaneous client/user errors] |
(Go To: Top | General Summary | Monthly Report | Daily Summary | Hourly Summary | Domain Report | Organization Report | Redirected Referrer Report | Failed Referrer Report | Referring Site Report | Browser Report | Browser Summary | Operating System Report | Status Code Report | File Size Report | File Type Report | Directory Report | Request Report)

| size | #reqs | %bytes |
|---|---|---|
| 0 | 202 | |
| 1B- 10B | 0 | |
| 11B- 100B | 109 | 0.08% |
| 101B- 1kB | 609 | 1.68% |
| 1kB- 10kB | 384 | 11.30% |
| 10kB-100kB | 153 | 48.54% |
| 100kB- 1MB | 22 | 38.39% |
(Go To: Top | General Summary | Monthly Report | Daily Summary | Hourly Summary | Domain Report | Organization Report | Redirected Referrer Report | Failed Referrer Report | Referring Site Report | Browser Report | Browser Summary | Operating System Report | Status Code Report | File Size Report | File Type Report | Directory Report | Request Report)

Listing extensions with at least 0.1% of the traffic, sorted by the amount of traffic.
| #reqs | %bytes | extension |
|---|---|---|
| 223 | 67.85% | .js [JavaScript code] |
| 208 | 20.76% | .jpg [JPEG graphics] |
| 613 | 5.53% | .php [PHP] |
| 120 | 2.93% | .css [Cascading Style Sheets] |
| 243 | 1.88% | .png [PNG graphics] |
| 47 | 0.88% | [directories] |
| 25 | 0.15% | .gif [GIF graphics] |
(Go To: Top | General Summary | Monthly Report | Daily Summary | Hourly Summary | Domain Report | Organization Report | Redirected Referrer Report | Failed Referrer Report | Referring Site Report | Browser Report | Browser Summary | Operating System Report | Status Code Report | File Size Report | File Type Report | Directory Report | Request Report)

Listing directories with at least 0.01% of the traffic, sorted by the amount of traffic.
| #reqs | %bytes | directory |
|---|---|---|
| 460 | 62.11% | /catalog/ |
| 248 | 21.41% | /image/ |
| 646 | 13.31% | /admin/ |
| 125 | 3.18% | [root directory] |
(Go To: Top | General Summary | Monthly Report | Daily Summary | Hourly Summary | Domain Report | Organization Report | Redirected Referrer Report | Failed Referrer Report | Referring Site Report | Browser Report | Browser Summary | Operating System Report | Status Code Report | File Size Report | File Type Report | Directory Report | Request Report)

Listing files with at least 20 requests, sorted by the number of requests.
| #reqs | %bytes | last time | file |
|---|---|---|---|
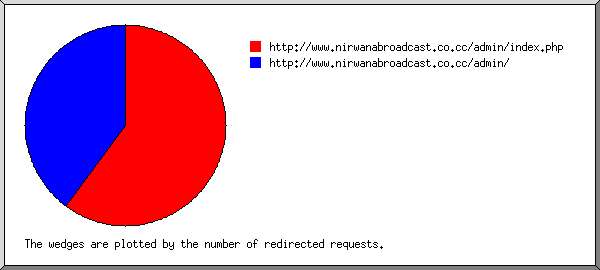
| 527 | 3.15% | Sep/ 1/12 9:06 PM | /admin/index.php |
| 38 | 0.06% | Sep/ 1/12 7:40 PM | /admin/index.php?route=common/filemanager/files&token=72fdb097947216f454ca7fe307c9435a |
| 19 | 0.03% | Sep/ 1/12 4:09 PM | /admin/index.php?route=common/filemanager/files&token=11e5aee9afcda280eb19cc85a7d34381 |
| 19 | 0.02% | Sep/ 1/12 7:40 PM | /admin/index.php?route=common/filemanager/image&token=72fdb097947216f454ca7fe307c9435a&image=data/NIRWANA BROADCAST/402927_2251391861178_550663460_n.jpg |
| 18 | 0.02% | Sep/ 1/12 7:40 PM | /admin/index.php?route=common/filemanager/image&token=72fdb097947216f454ca7fe307c9435a&image=data/NIRWANA BROADCAST/486216_2229701318928_1574410043_n.jpg |
| 18 | 0.01% | Sep/ 1/12 7:40 PM | /admin/index.php?route=common/filemanager/image&token=72fdb097947216f454ca7fe307c9435a&image=data/cart.png |
| 17 | 0.02% | Sep/ 1/12 7:40 PM | /admin/index.php?route=common/filemanager/image&token=72fdb097947216f454ca7fe307c9435a&image=data/NIRWANA BROADCAST/READY PA300 1.jpg |
| 17 | 0.02% | Sep/ 1/12 7:40 PM | /admin/index.php?route=common/filemanager/image&token=72fdb097947216f454ca7fe307c9435a&image=data/NIRWANA BROADCAST/406213_2277203506453_833775988_n.jpg |
| 17 | 0.01% | Sep/ 1/12 7:40 PM | /admin/index.php?route=common/filemanager/image&token=72fdb097947216f454ca7fe307c9435a&image=data/logo.png |
| 17 | 0.02% | Sep/ 1/12 7:40 PM | /admin/index.php?route=common/filemanager/image&token=72fdb097947216f454ca7fe307c9435a&image=data/NIRWANA BROADCAST/185962_2290418276814_345363684_n.jpg |
| 15 | 0.02% | Sep/ 1/12 7:40 PM | /admin/index.php?route=common/filemanager/image&token=72fdb097947216f454ca7fe307c9435a&image=data/NIRWANA BROADCAST/READY PA300 PA600.jpg |
| 13 | 0.02% | Sep/ 1/12 7:59 PM | /admin/index.php?route=common/filemanager/files&token=eed31a3084a0e00e6bf2d6fa789528b8 |
| 12 | 0.01% | Sep/ 1/12 7:40 PM | /admin/index.php?route=common/filemanager/directory&token=72fdb097947216f454ca7fe307c9435a |
| 10 | 0.01% | Sep/ 1/12 7:59 PM | /admin/index.php?route=common/filemanager/image&token=eed31a3084a0e00e6bf2d6fa789528b8&image=data/NIRWANA BROADCAST/READY PA300 PA600.jpg |
| 86 | 2.38% | Sep/24/12 6:17 AM | /index.php |
| 18 | 0.49% | Sep/23/12 11:10 PM | /index.php?route=product/category&path=59 |
| 18 | 0.51% | Sep/24/12 6:17 AM | /index.php?route=product/category&path=61 |
| 18 | 0.49% | Sep/23/12 11:10 PM | /index.php?route=product/category&path=62 |
| 16 | 0.45% | Sep/23/12 11:10 PM | /index.php?route=product/category&path=60 |
| 16 | 0.45% | Sep/23/12 11:10 PM | /index.php?route=product/category&path=63 |
| 39 | 0.80% | Sep/23/12 11:09 PM | / |
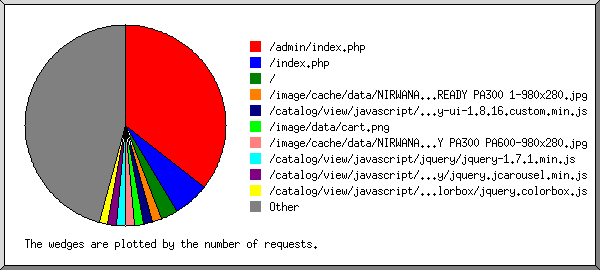
| 22 | 5.52% | Sep/23/12 11:09 PM | /image/cache/data/NIRWANA BROADCAST/READY PA300 1-980x280.jpg |
| 22 | 33.38% | Sep/23/12 11:09 PM | /catalog/view/javascript/jquery/ui/jquery-ui-1.8.16.custom.min.js |
| 21 | 0.07% | Sep/23/12 11:09 PM | /image/data/cart.png |
| 21 | 5.44% | Sep/23/12 11:09 PM | /image/cache/data/NIRWANA BROADCAST/READY PA300 PA600-980x280.jpg |
| 21 | 14.75% | Sep/23/12 11:09 PM | /catalog/view/javascript/jquery/jquery-1.7.1.min.js |
| 21 | 2.46% | Sep/23/12 11:09 PM | /catalog/view/javascript/jquery/jquery.jcarousel.min.js |
| 21 | 4.37% | Sep/23/12 11:09 PM | /catalog/view/javascript/jquery/colorbox/jquery.colorbox.js |
| 21 | 1.83% | Sep/23/12 11:09 PM | /catalog/view/javascript/jquery/nivo-slider/jquery.nivo.slider.pack.js |
| 21 | 1.21% | Sep/23/12 11:09 PM | /catalog/view/javascript/jquery/ui/themes/ui-lightness/jquery-ui-1.8.16.custom.css |
| 21 | 1.02% | Sep/23/12 11:09 PM | /catalog/view/theme/default/stylesheet/stylesheet.css |
| 21 | 0.07% | Sep/23/12 11:09 PM | /catalog/view/javascript/jquery/tabs.js |
| 21 | 0.10% | Sep/23/12 11:09 PM | /catalog/view/theme/default/stylesheet/carousel.css |
| 21 | 0.57% | Sep/23/12 11:09 PM | /catalog/view/javascript/jquery/ui/external/jquery.cookie.js |
| 21 | 0.18% | Sep/23/12 11:09 PM | /catalog/view/javascript/jquery/colorbox/colorbox.css |
| 21 | 0.79% | Sep/23/12 11:09 PM | /catalog/view/javascript/common.js |
| 20 | 0.05% | Sep/23/12 11:09 PM | /catalog/view/theme/default/image/button-previous.png |
| 20 | 0.03% | Sep/23/12 11:09 PM | /catalog/view/theme/default/image/arrow-down.png |
| 20 | 0.04% | Sep/23/12 11:09 PM | /catalog/view/theme/default/image/background.png |
| 20 | 0.16% | Sep/23/12 11:09 PM | /catalog/view/theme/default/stylesheet/slideshow.css |
| 20 | 0.06% | Sep/23/12 11:09 PM | /catalog/view/theme/default/image/button-next.png |
| 20 | 4.07% | Sep/23/12 11:09 PM | /image/cache/data/NIRWANA BROADCAST/READY PA600-980x280.jpg |
| 20 | 0.07% | Sep/23/12 11:09 PM | /catalog/view/theme/default/image/button-search.png |
| 370 | 17.39% | Sep/23/12 11:09 PM | [not listed: 103 files] |
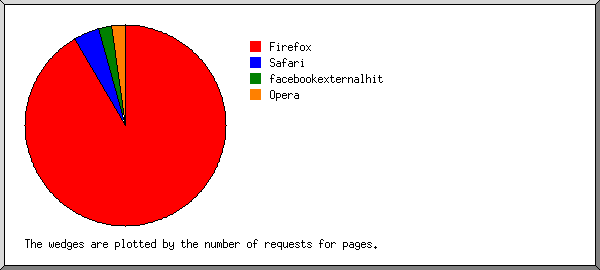
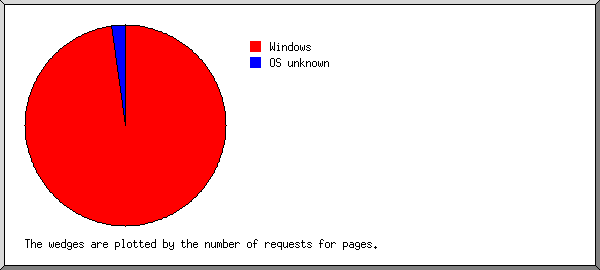
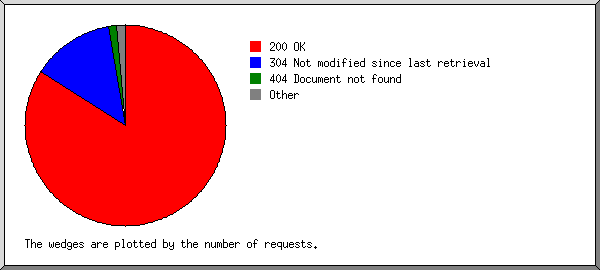
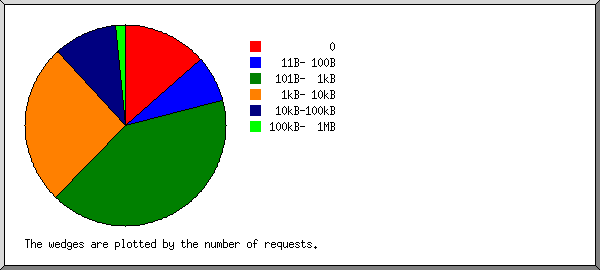
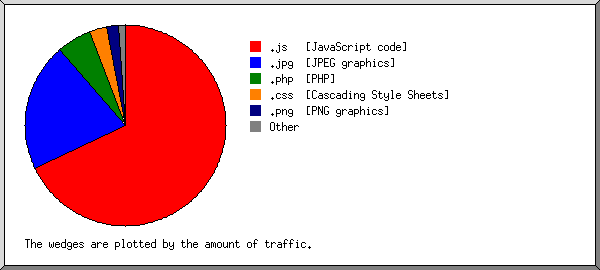
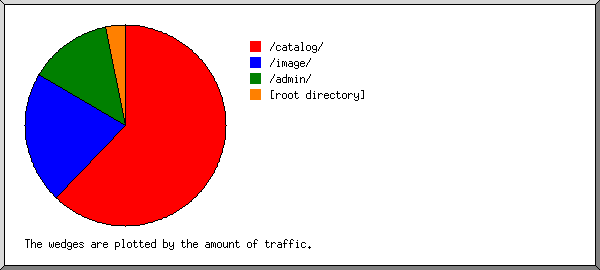