 Web Server Statistics for saga.vinhostmedia.com
Program started on Sat, May 30 2020 at 4:58 PM.
Analyzed requests from Fri, Nov 01 2019 at 4:32 AM to Sat, May 30 2020 at 12:27 PM (211.33 days).
Web Server Statistics for saga.vinhostmedia.comProgram started on Sat, May 30 2020 at 4:58 PM.
Analyzed requests from Fri, Nov 01 2019 at 4:32 AM to Sat, May 30 2020 at 12:27 PM (211.33 days).
(Go To: Top | General Summary | Monthly Report | Daily Summary | Hourly Summary | Domain Report | Organization Report | Browser Report | Browser Summary | Operating System Report | Status Code Report | File Size Report | File Type Report | Directory Report | Request Report)
Figures in parentheses refer to the 7-day period ending May 30 2020 at 4:58 PM.
Successful requests: 6,617 (1)
Average successful requests per day: 31
Successful requests for pages: 6,064 (1)
Average successful requests for pages per day: 28
Failed requests: 3,915 (0)
Distinct files requested: 16 (37)
Distinct hosts served: 182 (278)
Data transferred: 5.48 megabytes (1.15 kilobytes)
Average data transferred per day: 26.54 kilobytes (168 bytes)
(Go To: Top | General Summary | Monthly Report | Daily Summary | Hourly Summary | Domain Report | Organization Report | Browser Report | Browser Summary | Operating System Report | Status Code Report | File Size Report | File Type Report | Directory Report | Request Report)
Each unit ( ) represents 80 requests for pages or part thereof.
| month | #reqs | #pages | |
|---|---|---|---|
| Nov 2019 | 556 | 504 |   |
| Dec 2019 | 1349 | 1166 |  |
| Jan 2020 | 594 | 548 | |
| Feb 2020 | 592 | 559 | |
| Mar 2020 | 2630 | 2468 |  |
| Apr 2020 | 753 | 682 | |
| May 2020 | 143 | 137 | |
Busiest month: Mar 2020 (2,468 requests for pages).
(Go To: Top | General Summary | Monthly Report | Daily Summary | Hourly Summary | Domain Report | Organization Report | Browser Report | Browser Summary | Operating System Report | Status Code Report | File Size Report | File Type Report | Directory Report | Request Report)
Each unit () represents 40 requests for pages or part thereof.
| day | #reqs | #pages | |
|---|---|---|---|
| Sun | 431 | 362 | |
| Mon | 1072 | 997 | |
| Tue | 1425 | 1421 |  |
| Wed | 728 | 634 | |
| Thu | 1135 | 1058 | |
| Fri | 858 | 662 | |
| Sat | 968 | 930 | |
(Go To: Top | General Summary | Monthly Report | Daily Summary | Hourly Summary | Domain Report | Organization Report | Browser Report | Browser Summary | Operating System Report | Status Code Report | File Size Report | File Type Report | Directory Report | Request Report)
Each unit () represents 10 requests for pages or part thereof.
| hour | #reqs | #pages | |
|---|---|---|---|
| 0 | 249 | 249 | |
| 1 | 317 | 241 | |
| 2 | 156 | 153 | |
| 3 | 247 | 199 | |
| 4 | 276 | 255 | |
| 5 | 381 | 358 | |
| 6 | 274 | 274 | |
| 7 | 237 | 237 | |
| 8 | 216 | 216 | |
| 9 | 371 | 339 | |
| 10 | 185 | 145 | |
| 11 | 230 | 161 | |
| 12 | 64 | 62 | |
| 13 | 356 | 350 | |
| 14 | 282 | 221 | |
| 15 | 322 | 292 | |
| 16 | 354 | 354 | |
| 17 | 263 | 252 | |
| 18 | 399 | 399 | |
| 19 | 282 | 263 | |
| 20 | 191 | 191 | |
| 21 | 261 | 205 | |
| 22 | 263 | 249 | |
| 23 | 441 | 399 | |
(Go To: Top | General Summary | Monthly Report | Daily Summary | Hourly Summary | Domain Report | Organization Report | Browser Report | Browser Summary | Operating System Report | Status Code Report | File Size Report | File Type Report | Directory Report | Request Report)
Listing domains, sorted by the amount of traffic.
| #reqs | %bytes | domain |
|---|---|---|
| 6617 | 100% | [unresolved numerical addresses] |
(Go To: Top | General Summary | Monthly Report | Daily Summary | Hourly Summary | Domain Report | Organization Report | Browser Report | Browser Summary | Operating System Report | Status Code Report | File Size Report | File Type Report | Directory Report | Request Report)
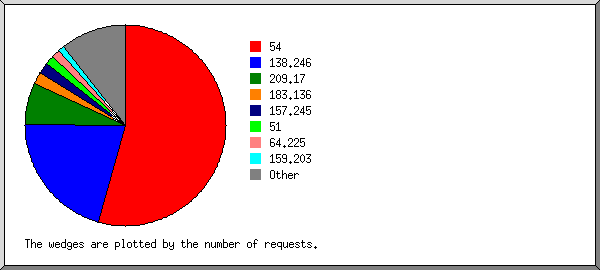
Listing the top 20 organizations by the number of requests, sorted by the number of requests.
| #reqs | %bytes | organization |
|---|---|---|
| 4253 | 73.42% | 54 |
| 1067 | 138.246 | |
| 410 | 8.40% | 209.17 |
| 101 | 2.07% | 157.245 |
| 80 | 1.64% | 64.225 |
| 71 | 1.45% | 209.97 |
| 69 | 1.41% | 51 |
| 67 | 1.37% | 163.172 |
| 64 | 1.31% | 165.227 |
| 57 | 1.17% | 60 |
| 57 | 1.17% | 167.71 |
| 56 | 1.15% | 195.154 |
| 56 | 1.15% | 62.210 |
| 54 | 1.11% | 159.203 |
| 54 | 1.11% | 174.138 |
| 44 | 0.90% | 199.229 |
| 26 | 0.53% | 170.130 |
| 16 | 0.33% | 119 |
| 9 | 0.18% | 134.122 |
| 5 | 0.10% | 42 |
| 1 | 0.02% | [not listed: 1 organization] |
(Go To: Top | General Summary | Monthly Report | Daily Summary | Hourly Summary | Domain Report | Organization Report | Browser Report | Browser Summary | Operating System Report | Status Code Report | File Size Report | File Type Report | Directory Report | Request Report)
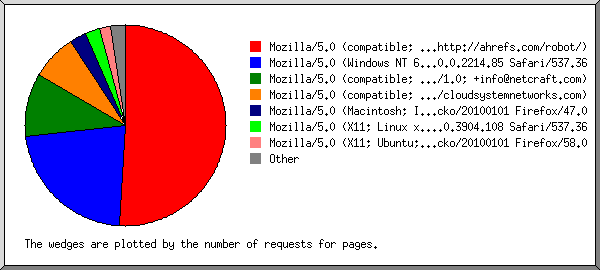
Listing browsers with at least 1 request for a page, sorted by the number of requests for pages.
| #reqs | #pages | browser |
|---|---|---|
| 4253 | 3700 | Mozilla/5.0 (compatible; AhrefsBot/6.1; +http://ahrefs.com/robot/) |
| 1067 | 1067 | Mozilla/5.0 (Windows NT 6.1; Win64; x64) AppleWebKit/537.36 (KHTML, like Gecko) Chrome/40.0.2214.85 Safari/537.36 |
| 490 | 490 | Mozilla/5.0 (compatible; NetcraftSurveyAgent/1.0; [email protected]) |
| 410 | 410 | Mozilla/5.0 (compatible; Nimbostratus-Bot/v1.3.2; http://cloudsystemnetworks.com) |
| 136 | 136 | Mozilla/5.0 (X11; Linux x86_64) AppleWebKit/537.36 (KHTML, like Gecko) Chrome/78.0.3904.108 Safari/537.36 |
| 112 | 112 | Mozilla/5.0 (X11; Ubuntu; Linux x86_64; rv:58.0) Gecko/20100101 Firefox/58.0 |
| 58 | 58 | Mozilla/5.0 (Macintosh; Intel Mac OS X 10.11; rv:47.0) Gecko/20100101 Firefox/47.0 |
| 44 | 44 | Mozilla/5.0 (X11; Ubuntu; Linux x86_64; rv:62.0) Gecko/20100101 Firefox/62.0 |
| 26 | 26 | https://gdnplus.com:Gather Analyze Provide. |
| 16 | 16 | Mozilla/5.0 (Macintosh; Intel Mac OS X 10_14_6) AppleWebKit/537.36 (KHTML, like Gecko) Chrome/76.0.3809.132 Safari/537.36 |
| 5 | 5 | Mozilla/5.0 |
(Go To: Top | General Summary | Monthly Report | Daily Summary | Hourly Summary | Domain Report | Organization Report | Browser Report | Browser Summary | Operating System Report | Status Code Report | File Size Report | File Type Report | Directory Report | Request Report)
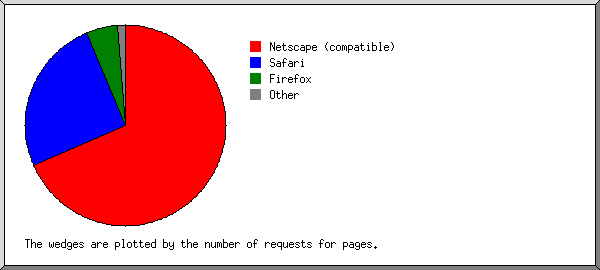
Listing browsers with at least 1 request for a page, sorted by the number of requests for pages.
| # | #reqs | #pages | browser |
|---|---|---|---|
| 1 | 5153 | 4600 | Netscape (compatible) |
| 2 | 1219 | 1219 | Safari |
| 1219 | 1219 | Safari/537 | |
| 3 | 214 | 214 | Firefox |
| 112 | 112 | Firefox/58 | |
| 58 | 58 | Firefox/47 | |
| 44 | 44 | Firefox/62 | |
| 4 | 26 | 26 | https: |
| 26 | 26 | https://gdnplus | |
| 5 | 5 | 5 | Mozilla |
(Go To: Top | General Summary | Monthly Report | Daily Summary | Hourly Summary | Domain Report | Organization Report | Browser Report | Browser Summary | Operating System Report | Status Code Report | File Size Report | File Type Report | Directory Report | Request Report)

Listing operating systems, sorted by the number of requests for pages.
| # | #reqs | #pages | OS |
|---|---|---|---|
| 1 | 4253 | 3700 | Known robots |
| 2 | 1067 | 1067 | Windows |
| 1067 | 1067 | Unknown Windows | |
| 3 | 931 | 931 | OS unknown |
| 4 | 292 | 292 | Unix |
| 292 | 292 | Linux | |
| 5 | 74 | 74 | Macintosh |
(Go To: Top | General Summary | Monthly Report | Daily Summary | Hourly Summary | Domain Report | Organization Report | Browser Report | Browser Summary | Operating System Report | Status Code Report | File Size Report | File Type Report | Directory Report | Request Report)

Listing status codes, sorted numerically.
| #reqs | status code |
|---|---|
| 6617 | 200 OK |
| 3888 | 404 Document not found |
| 27 | 500 Internal server error |
(Go To: Top | General Summary | Monthly Report | Daily Summary | Hourly Summary | Domain Report | Organization Report | Browser Report | Browser Summary | Operating System Report | Status Code Report | File Size Report | File Type Report | Directory Report | Request Report)
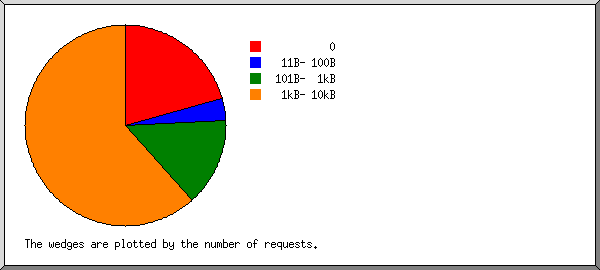
| size | #reqs | %bytes |
|---|---|---|
| 0 | 1067 | |
| 1B- 10B | 0 | |
| 11B- 100B | 298 | 0.27% |
| 101B- 1kB | 1068 | 13.98% |
| 1kB- 10kB | 4184 | 85.74% |
(Go To: Top | General Summary | Monthly Report | Daily Summary | Hourly Summary | Domain Report | Organization Report | Browser Report | Browser Summary | Operating System Report | Status Code Report | File Size Report | File Type Report | Directory Report | Request Report)

Listing extensions with at least 0.1% of the traffic, sorted by the amount of traffic.
| #reqs | %bytes | extension |
|---|---|---|
| 6064 | 98.97% | [directories] |
| 553 | 1.03% | .txt [Plain text] |
(Go To: Top | General Summary | Monthly Report | Daily Summary | Hourly Summary | Domain Report | Organization Report | Browser Report | Browser Summary | Operating System Report | Status Code Report | File Size Report | File Type Report | Directory Report | Request Report)

Listing directories with at least 0.01% of the traffic, sorted by the amount of traffic.
| #reqs | %bytes | directory |
|---|---|---|
| 5549 | 86.02% | [root directory] |
| 1068 | 13.98% | /685/ |
(Go To: Top | General Summary | Monthly Report | Daily Summary | Hourly Summary | Domain Report | Organization Report | Browser Report | Browser Summary | Operating System Report | Status Code Report | File Size Report | File Type Report | Directory Report | Request Report)
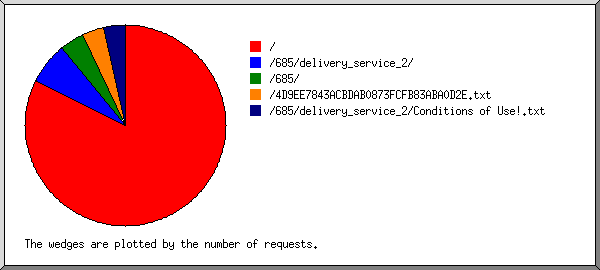
Listing files with at least 20 requests, sorted by the number of requests.
| #reqs | %bytes | last time | file |
|---|---|---|---|
| 5251 | 85.74% | May/30/20 12:27 PM | / |
| 277 | 5.68% | May/ 1/20 1:14 PM | /?C=S;O=D |
| 261 | 5.35% | Apr/30/20 4:44 AM | /?C=M;O=A |
| 237 | 4.86% | Apr/26/20 10:19 PM | /?C=S;O=A |
| 222 | 4.55% | May/ 6/20 3:12 AM | /?C=M;O=D |
| 176 | 3.61% | Apr/23/20 4:28 PM | /?C=D;O=D |
| 144 | 2.95% | May/ 2/20 6:56 PM | /?C=N;O=D |
| 33 | 0.68% | Feb/ 3/20 4:15 PM | /?54.36.148.170 |
| 521 | 9.24% | May/13/20 2:45 PM | /685/delivery_service_2/ |
| 271 | 4.81% | May/13/20 2:45 PM | /685/delivery_service_2/?C=D;O=D |
| 298 | 0.27% | Apr/29/20 12:40 PM | /4D9EE7843ACBDAB0873FCFB83ABA0D2E.txt |
| 13 | 0.01% | Nov/ 1/19 4:32 AM | /4D9EE7843ACBDAB0873FCFB83ABA0D2E.txt?54.36.148.133 |
| 292 | 3.98% | May/ 1/20 12:26 AM | /685/ |
| 18 | 0.25% | May/ 1/20 12:26 AM | /685/?54.36.148.170 |
| 255 | 0.76% | May/11/20 1:32 PM | /685/delivery_service_2/Conditions of Use!.txt |