Web Server Statistics for socialmedia.vinhostmedia.comProgram started on Tue, Apr 28 2020 at 10:10 AM.
Analyzed requests from Sat, Nov 02 2019 at 4:29 AM to Tue, Apr 28 2020 at 9:54 AM (178.23 days).
(Go To: Top | General Summary | Monthly Report | Daily Summary | Hourly Summary | Domain Report | Organization Report | Browser Report | Browser Summary | Operating System Report | Status Code Report | File Size Report | File Type Report | Directory Report | Request Report)
Figures in parentheses refer to the 7-day period ending Apr 28 2020 at 10:10 AM.
Successful requests: 940 (6)
Average successful requests per day: 5 (0)
Successful requests for pages: 940 (6)
Average successful requests for pages per day: 5 (0)
Failed requests: 216 (0)
Distinct files requested: 7 (24)
Distinct hosts served: 43 (46)
Data transferred: 257.99 kilobytes (447 bytes)
Average data transferred per day: 1.45 kilobytes (63 bytes)
(Go To: Top | General Summary | Monthly Report | Daily Summary | Hourly Summary | Domain Report | Organization Report | Browser Report | Browser Summary | Operating System Report | Status Code Report | File Size Report | File Type Report | Directory Report | Request Report)
Each unit (
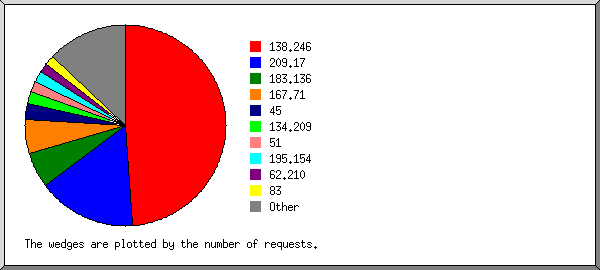
) represents 8 requests for pages or part thereof.
| month | #reqs | #pages | |
|---|---|---|---|
| Nov 2019 | 169 | 169 | ![]() ![]() ![]() |
| Dec 2019 | 184 | 184 | ![]() ![]() ![]() ![]() |
| Jan 2020 | 137 | 137 | ![]() ![]() |
| Feb 2020 | 54 | 54 | ![]() ![]() ![]() |
| Mar 2020 | 310 | 310 | ![]() ![]() ![]() ![]() |
| Apr 2020 | 86 | 86 | ![]() ![]() ![]() |
Busiest month: Mar 2020 (310 requests for pages).
(Go To: Top | General Summary | Monthly Report | Daily Summary | Hourly Summary | Domain Report | Organization Report | Browser Report | Browser Summary | Operating System Report | Status Code Report | File Size Report | File Type Report | Directory Report | Request Report)
Each unit (
) represents 5 requests for pages or part thereof.
| day | #reqs | #pages | |
|---|---|---|---|
| Sun | 96 | 96 | ![]() ![]() |
| Mon | 129 | 129 | ![]() ![]() ![]() |
| Tue | 195 | 195 | ![]() ![]() ![]() ![]() |
| Wed | 112 | 112 | ![]() ![]() ![]() ![]() |
| Thu | 117 | 117 | ![]() ![]() |
| Fri | 90 | 90 | ![]() ![]() |
| Sat | 201 | 201 | ![]() ![]() ![]() |
(Go To: Top | General Summary | Monthly Report | Daily Summary | Hourly Summary | Domain Report | Organization Report | Browser Report | Browser Summary | Operating System Report | Status Code Report | File Size Report | File Type Report | Directory Report | Request Report)
Each unit (
) represents 3 requests for pages or part thereof.
| hour | #reqs | #pages | |
|---|---|---|---|
| 0 | 22 | 22 | ![]() |
| 1 | 7 | 7 | ![]() ![]() |
| 2 | 28 | 28 | ![]() ![]() |
| 3 | 7 | 7 | ![]() ![]() |
| 4 | 43 | 43 | ![]() ![]() ![]() ![]() |
| 5 | 70 | 70 | ![]() ![]() |
| 6 | 51 | 51 | ![]() ![]() |
| 7 | 43 | 43 | ![]() ![]() ![]() ![]() |
| 8 | 99 | 99 | ![]() ![]() |
| 9 | 56 | 56 | ![]() ![]() ![]() |
| 10 | 57 | 57 | ![]() ![]() ![]() |
| 11 | 17 | 17 | ![]() ![]() |
| 12 | 46 | 46 | ![]() |
| 13 | 11 | 11 | ![]() |
| 14 | 34 | 34 | ![]() ![]() |
| 15 | 41 | 41 | ![]() ![]() ![]() |
| 16 | 66 | 66 | ![]() ![]() ![]() |
| 17 | 41 | 41 | ![]() ![]() ![]() |
| 18 | 35 | 35 | ![]() ![]() |
| 19 | 45 | 45 | ![]() ![]() ![]() ![]() |
| 20 | 28 | 28 | ![]() ![]() |
| 21 | 28 | 28 | ![]() ![]() |
| 22 | 11 | 11 | ![]() |
| 23 | 54 | 54 | ![]() ![]() |
(Go To: Top | General Summary | Monthly Report | Daily Summary | Hourly Summary | Domain Report | Organization Report | Browser Report | Browser Summary | Operating System Report | Status Code Report | File Size Report | File Type Report | Directory Report | Request Report)
Listing domains, sorted by the amount of traffic.
| #reqs | %bytes | domain |
|---|---|---|
| 940 | 100% | [unresolved numerical addresses] |
(Go To: Top | General Summary | Monthly Report | Daily Summary | Hourly Summary | Domain Report | Organization Report | Browser Report | Browser Summary | Operating System Report | Status Code Report | File Size Report | File Type Report | Directory Report | Request Report)

Listing organizations, sorted by the number of requests.
| #reqs | %bytes | organization |
|---|---|---|
| 349 | 138.246 | |
| 297 | 50.25% | 209.17 |
| 56 | 9.48% | 167.71 |
| 42 | 7.11% | 60 |
| 39 | 6.60% | 134.209 |
| 19 | 3.21% | 51 |
| 19 | 3.21% | 195.154 |
| 19 | 3.21% | 62.210 |
| 16 | 2.71% | 167.172 |
| 16 | 2.71% | 45 |
| 13 | 2.20% | 159.203 |
| 13 | 2.20% | 142.93 |
| 12 | 2.03% | 163.172 |
| 11 | 1.86% | 77 |
| 9 | 1.52% | 165.227 |
| 9 | 1.52% | 138.197 |
| 1 | 0.17% | 42 |
(Go To: Top | General Summary | Monthly Report | Daily Summary | Hourly Summary | Domain Report | Organization Report | Browser Report | Browser Summary | Operating System Report | Status Code Report | File Size Report | File Type Report | Directory Report | Request Report)

Listing browsers with at least 1 request for a page, sorted by the number of requests for pages.
| #reqs | #pages | browser |
|---|---|---|
| 349 | 349 | Mozilla/5.0 (Windows NT 6.1; Win64; x64) AppleWebKit/537.36 (KHTML, like Gecko) Chrome/40.0.2214.85 Safari/537.36 |
| 297 | 297 | Mozilla/5.0 (compatible; Nimbostratus-Bot/v1.3.2; http://cloudsystemnetworks.com) |
| 171 | 171 | Mozilla/5.0 (compatible; NetcraftSurveyAgent/1.0; [email protected]) |
| 42 | 42 | Mozilla/5.0 (Macintosh; Intel Mac OS X 10.11; rv:47.0) Gecko/20100101 Firefox/47.0 |
| 38 | 38 | Mozilla/5.0 (X11; Ubuntu; Linux x86_64; rv:58.0) Gecko/20100101 Firefox/58.0 |
| 31 | 31 | Mozilla/5.0 (X11; Linux x86_64) AppleWebKit/537.36 (KHTML, like Gecko) Chrome/78.0.3904.108 Safari/537.36 |
| 11 | 11 | Mozilla/5.0 (X11; Ubuntu; Linux x86_64; rv:62.0) Gecko/20100101 Firefox/62.0 |
| 1 | 1 | Mozilla/5.0 |
(Go To: Top | General Summary | Monthly Report | Daily Summary | Hourly Summary | Domain Report | Organization Report | Browser Report | Browser Summary | Operating System Report | Status Code Report | File Size Report | File Type Report | Directory Report | Request Report)

Listing browsers with at least 1 request for a page, sorted by the number of requests for pages.
| # | #reqs | #pages | browser |
|---|---|---|---|
| 1 | 468 | 468 | Netscape (compatible) |
| 2 | 380 | 380 | Safari |
| 380 | 380 | Safari/537 | |
| 3 | 91 | 91 | Firefox |
| 42 | 42 | Firefox/47 | |
| 38 | 38 | Firefox/58 | |
| 11 | 11 | Firefox/62 | |
| 4 | 1 | 1 | Mozilla |
(Go To: Top | General Summary | Monthly Report | Daily Summary | Hourly Summary | Domain Report | Organization Report | Browser Report | Browser Summary | Operating System Report | Status Code Report | File Size Report | File Type Report | Directory Report | Request Report)

Listing operating systems, sorted by the number of requests for pages.
| # | #reqs | #pages | OS |
|---|---|---|---|
| 1 | 469 | 469 | OS unknown |
| 2 | 349 | 349 | Windows |
| 349 | 349 | Unknown Windows | |
| 3 | 80 | 80 | Unix |
| 80 | 80 | Linux | |
| 4 | 42 | 42 | Macintosh |
(Go To: Top | General Summary | Monthly Report | Daily Summary | Hourly Summary | Domain Report | Organization Report | Browser Report | Browser Summary | Operating System Report | Status Code Report | File Size Report | File Type Report | Directory Report | Request Report)

Listing status codes, sorted numerically.
| #reqs | status code |
|---|---|
| 940 | 200 OK |
| 216 | 500 Internal server error |
(Go To: Top | General Summary | Monthly Report | Daily Summary | Hourly Summary | Domain Report | Organization Report | Browser Report | Browser Summary | Operating System Report | Status Code Report | File Size Report | File Type Report | Directory Report | Request Report)

| size | #reqs | %bytes |
|---|---|---|
| 0 | 349 | |
| 1B- 10B | 0 | |
| 11B- 100B | 0 | |
| 101B- 1kB | 591 | 100% |
(Go To: Top | General Summary | Monthly Report | Daily Summary | Hourly Summary | Domain Report | Organization Report | Browser Report | Browser Summary | Operating System Report | Status Code Report | File Size Report | File Type Report | Directory Report | Request Report)
Listing extensions with at least 0.1% of the traffic, sorted by the amount of traffic.
| #reqs | %bytes | extension |
|---|---|---|
| 940 | 100% | [directories] |
(Go To: Top | General Summary | Monthly Report | Daily Summary | Hourly Summary | Domain Report | Organization Report | Browser Report | Browser Summary | Operating System Report | Status Code Report | File Size Report | File Type Report | Directory Report | Request Report)
Listing directories with at least 0.01% of the traffic, sorted by the amount of traffic.
| #reqs | %bytes | directory |
|---|---|---|
| 940 | 100% | [root directory] |
(Go To: Top | General Summary | Monthly Report | Daily Summary | Hourly Summary | Domain Report | Organization Report | Browser Report | Browser Summary | Operating System Report | Status Code Report | File Size Report | File Type Report | Directory Report | Request Report)
Listing files with at least 20 requests, sorted by the number of requests.
| #reqs | %bytes | last time | file |
|---|---|---|---|
| 940 | 100% | Apr/28/20 9:54 AM | / |
| 28 | 4.74% | Mar/ 4/20 10:51 AM | /?209.17.96.178 |
| 23 | 0.85% | Mar/ 4/20 10:51 AM | /?209.17.96.138 |
| 10 | 1.69% | Dec/ 4/19 8:34 AM | /?159.203.85.167 |