Web Server Statistics for tunasgading.vinhostmedia.co.id
Program started on Tue, Jun 01 2021 at 6:41 PM.
Analyzed requests from Sun, Dec 11 2016 at 8:44 AM to Mon, Apr 09 2018 at 4:06 PM (484.31 days).
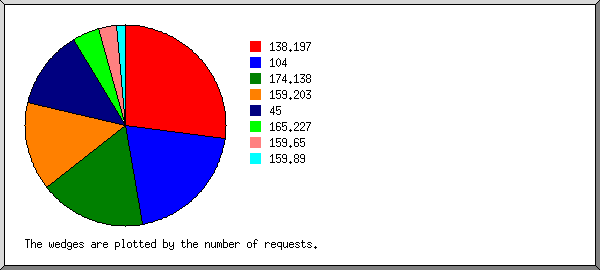
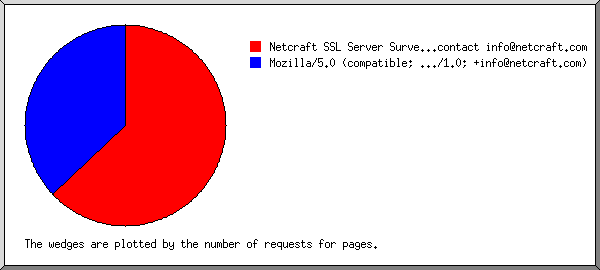
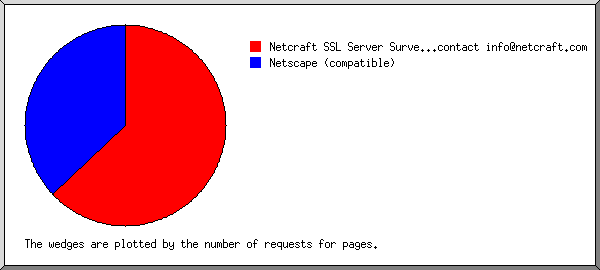
 ) represents 1 request for a page.