Web Server Statistics for web.vinhostmedia.co.id
Program started on Thu, Dec 10 2020 at 1:23 AM.
Analyzed requests from Sun, Dec 11 2016 at 3:05 AM to Mon, Apr 09 2018 at 4:15 PM (484.55 days).
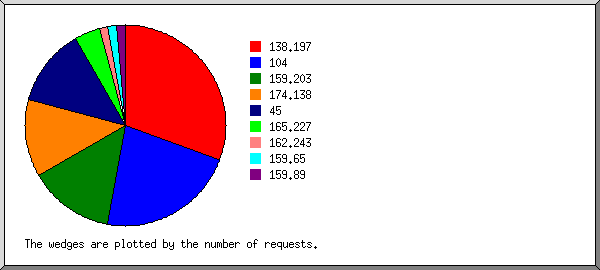
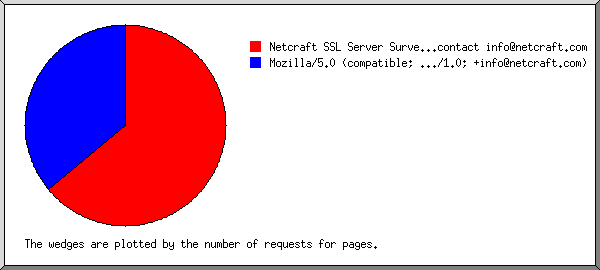
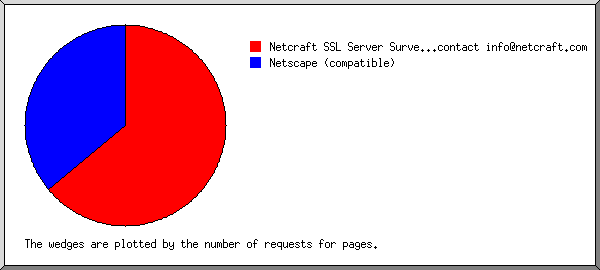
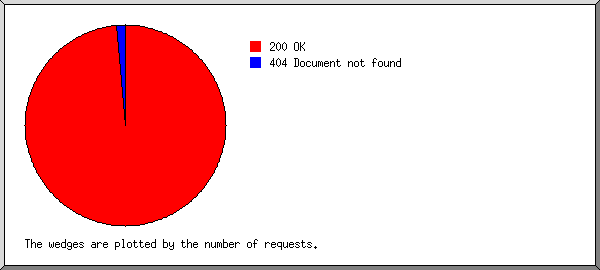
 ) represents 1 request for a page.