Web Server Statistics for transfer.web.vinhostmedia.co.id
Program started on Tue, Jun 01 2021 at 6:41 PM.
Analyzed requests from Fri, Dec 08 2017 at 3:06 AM to Wed, Feb 14 2018 at 12:31 AM (67.89 days).
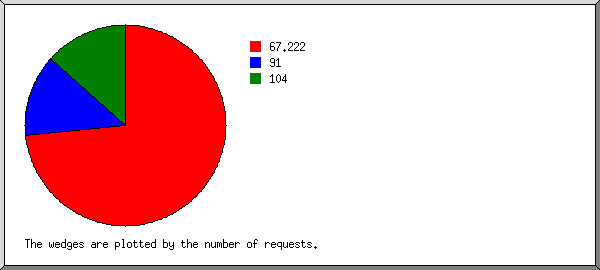
 ) represents 1 request for a page.